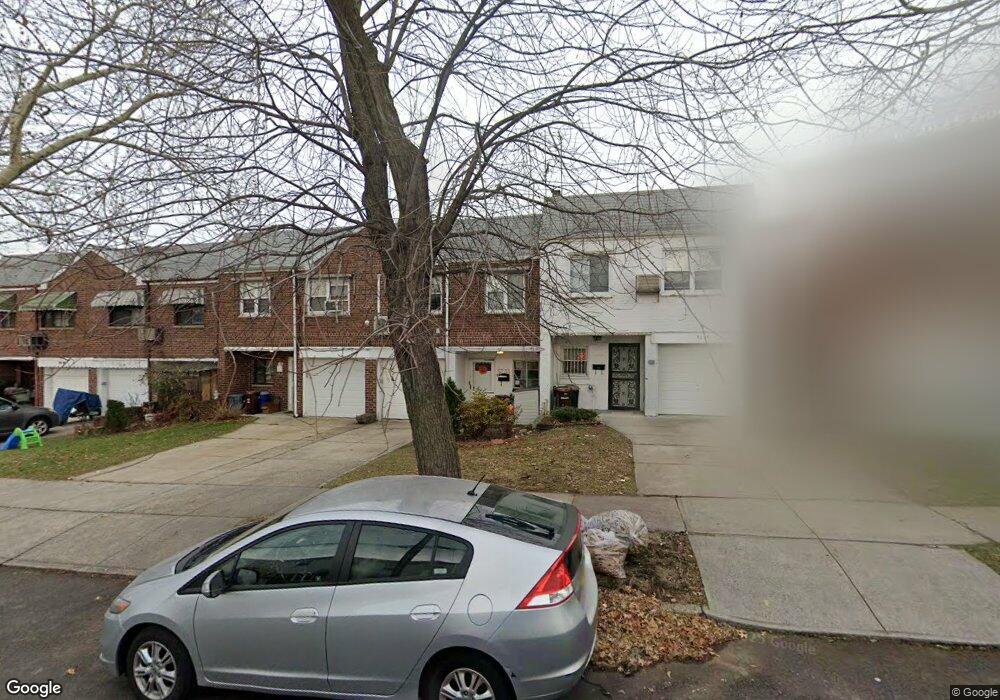
5733 156th St Flushing, NY 11355
Queensboro Hill NeighborhoodEstimated Value: $1,007,388 - $1,069,000
Studio
--
Bath
1,560
Sq Ft
$665/Sq Ft
Est. Value
About This Home
This home is located at 5733 156th St, Flushing, NY 11355 and is currently estimated at $1,036,847, approximately $664 per square foot. 5733 156th St is a home located in Queens County with nearby schools including P.S. 163 - Flushing Heights, Rachel Carson I.S. 237Q, and Francis Lewis High School.
Ownership History
Date
Name
Owned For
Owner Type
Purchase Details
Closed on
Oct 13, 2021
Sold by
Bao Dan Rong
Bought by
Yang Jinquan and Yang Zhao Xiong
Current Estimated Value
Home Financials for this Owner
Home Financials are based on the most recent Mortgage that was taken out on this home.
Original Mortgage
$642,200
Outstanding Balance
$585,627
Interest Rate
2.8%
Mortgage Type
Purchase Money Mortgage
Estimated Equity
$451,220
Purchase Details
Closed on
Aug 13, 2015
Sold by
Fang Eric and Fang George
Bought by
Bao Dan Rong
Home Financials for this Owner
Home Financials are based on the most recent Mortgage that was taken out on this home.
Original Mortgage
$393,250
Interest Rate
4.07%
Mortgage Type
New Conventional
Purchase Details
Closed on
May 11, 2011
Sold by
Dawn Eckert Executrix
Bought by
Fang Eric and Fang George
Home Financials for this Owner
Home Financials are based on the most recent Mortgage that was taken out on this home.
Original Mortgage
$254,000
Interest Rate
4.94%
Mortgage Type
Purchase Money Mortgage
Create a Home Valuation Report for This Property
The Home Valuation Report is an in-depth analysis detailing your home's value as well as a comparison with similar homes in the area
Home Values in the Area
Average Home Value in this Area
Purchase History
| Date | Buyer | Sale Price | Title Company |
|---|---|---|---|
| Yang Jinquan | $988,000 | -- | |
| Bao Dan Rong | $740,000 | -- | |
| Fang Eric | $508,000 | -- |
Source: Public Records
Mortgage History
| Date | Status | Borrower | Loan Amount |
|---|---|---|---|
| Open | Yang Jinquan | $642,200 | |
| Previous Owner | Bao Dan Rong | $393,250 | |
| Previous Owner | Fang Eric | $254,000 |
Source: Public Records
Tax History
| Year | Tax Paid | Tax Assessment Tax Assessment Total Assessment is a certain percentage of the fair market value that is determined by local assessors to be the total taxable value of land and additions on the property. | Land | Improvement |
|---|---|---|---|---|
| 2025 | $7,716 | $40,722 | $7,460 | $33,262 |
| 2024 | $7,716 | $38,417 | $7,490 | $30,927 |
| 2023 | $7,716 | $38,417 | $7,146 | $31,271 |
| 2022 | $7,611 | $54,780 | $11,640 | $43,140 |
| 2021 | $7,570 | $52,920 | $11,640 | $41,280 |
| 2020 | $7,183 | $55,560 | $11,640 | $43,920 |
| 2019 | $6,697 | $55,380 | $11,640 | $43,740 |
| 2018 | $6,526 | $32,014 | $7,394 | $24,620 |
| 2017 | $6,476 | $31,771 | $8,015 | $23,756 |
| 2016 | $5,371 | $31,771 | $8,015 | $23,756 |
| 2015 | $3,176 | $28,279 | $8,814 | $19,465 |
| 2014 | $3,176 | $26,679 | $9,132 | $17,547 |
Source: Public Records
Map
Nearby Homes
- 59-41 156th St
- 59-09 Kissena Blvd
- 159-08 59th Ave
- 5944 159th St
- 6111 156th St
- 6113 156th St
- 54-29 153rd St
- 54-23 153rd St
- 153-51 Horace Harding Expy
- 61-12 160th St
- 6143 157th St
- 54-26 152nd St
- 152-10 Peck Ave
- 155-17 65th Ave
- 6126 160th St
- 150-40 60th Ave
- 152-12 Peck Ave
- 150-12 59th Ave
- 154-28 65th Ave
- 58-33 150th St
- 5733 156th St Unit 1Fl
- 5733 156th St
- 5731 156th St
- 5735 156th St
- 5731 156th St Unit 1Fl
- 5731 156th St
- 5729 156th St
- 5737 156th St
- 5727 156th St
- 5739 156th St
- 5725 156th St
- 5741 156th St
- 57-25 156th St Unit 2Fl
- 57-25 156th St Unit 1
- 5741 156th St
- 5728 157th St
- 5723 156th St
- 5732 157th St
- 57-32 157th St
- 5743 156th St
Your Personal Tour Guide
Ask me questions while you tour the home.