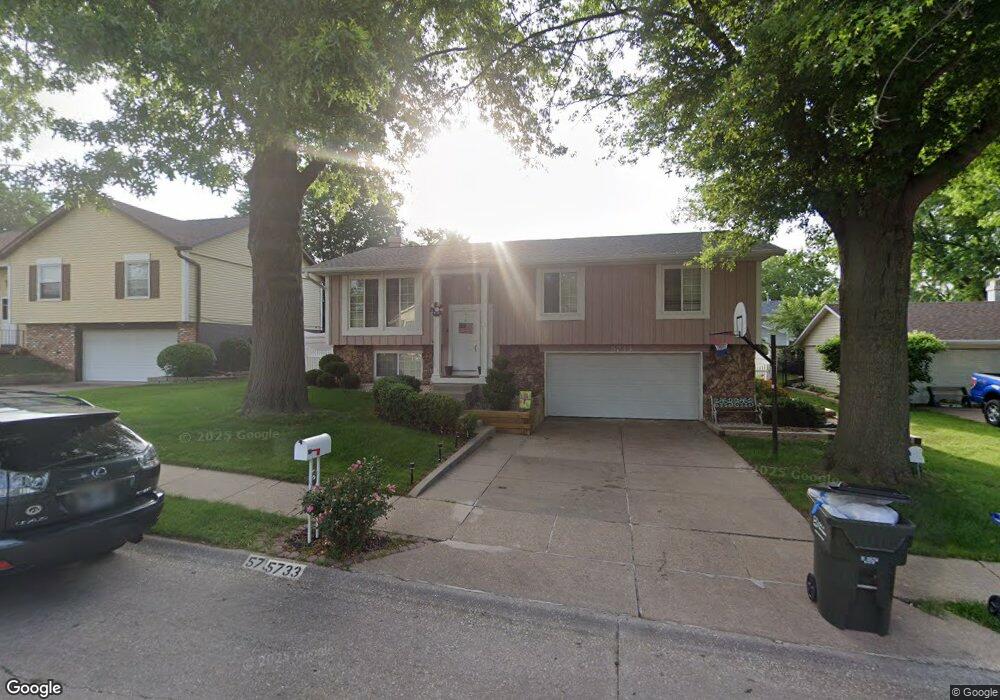
5733 N Fillmore St Davenport, IA 52806
North Side NeighborhoodEstimated Value: $276,404 - $294,000
3
Beds
3
Baths
1,836
Sq Ft
$156/Sq Ft
Est. Value
About This Home
This home is located at 5733 N Fillmore St, Davenport, IA 52806 and is currently estimated at $286,351, approximately $155 per square foot. 5733 N Fillmore St is a home located in Scott County with nearby schools including Cumberland Hall School, Harrison Elementary School, and Academy Of Continuing Education.
Ownership History
Date
Name
Owned For
Owner Type
Purchase Details
Closed on
Dec 6, 2022
Sold by
Rivera Jose L and Rivera Carmen M
Bought by
Campbell Teisha
Current Estimated Value
Home Financials for this Owner
Home Financials are based on the most recent Mortgage that was taken out on this home.
Original Mortgage
$243,508
Outstanding Balance
$235,475
Interest Rate
6.61%
Mortgage Type
FHA
Estimated Equity
$50,876
Create a Home Valuation Report for This Property
The Home Valuation Report is an in-depth analysis detailing your home's value as well as a comparison with similar homes in the area
Home Values in the Area
Average Home Value in this Area
Purchase History
| Date | Buyer | Sale Price | Title Company |
|---|---|---|---|
| Campbell Teisha | $248,000 | None Listed On Document |
Source: Public Records
Mortgage History
| Date | Status | Borrower | Loan Amount |
|---|---|---|---|
| Open | Campbell Teisha | $243,508 |
Source: Public Records
Tax History Compared to Growth
Tax History
| Year | Tax Paid | Tax Assessment Tax Assessment Total Assessment is a certain percentage of the fair market value that is determined by local assessors to be the total taxable value of land and additions on the property. | Land | Improvement |
|---|---|---|---|---|
| 2025 | $3,848 | $264,010 | $32,890 | $231,120 |
| 2024 | $4,522 | $225,490 | $32,890 | $192,600 |
| 2023 | $3,470 | $225,490 | $32,890 | $192,600 |
| 2022 | $3,484 | $171,360 | $28,410 | $142,950 |
| 2021 | $3,484 | $171,360 | $28,410 | $142,950 |
| 2020 | $3,448 | $167,500 | $28,410 | $139,090 |
| 2019 | $3,336 | $157,190 | $28,410 | $128,780 |
| 2018 | $3,120 | $157,190 | $28,410 | $128,780 |
| 2017 | $838 | $150,750 | $28,410 | $122,340 |
| 2016 | $3,110 | $150,750 | $0 | $0 |
| 2015 | $3,110 | $144,180 | $0 | $0 |
| 2014 | $3,008 | $144,180 | $0 | $0 |
| 2013 | $2,952 | $0 | $0 | $0 |
| 2012 | -- | $140,410 | $29,230 | $111,180 |
Source: Public Records
Map
Nearby Homes
- 5735 Taylor St
- 5721 Taylor St
- 1415 W 59th St
- 5804 Lillie Ave
- 1033 W 58th St
- 1005 W 58th St
- 1301 W 62nd Ct
- 6015 Vine St
- 5510 N Division St
- 5436 N Division St
- Lot 26 Benjamin Ct
- 1729 Welshire Dr
- 5210 N Division St
- LOT 54 Franklin Ave
- Lot 56 Franklin Ave
- 6308 Appomattox Rd
- 1629 W 66th St
- 6112 Western Ave
- 6322 Appomattox Rd
- 671 W 64th St
- 5801 N Fillmore St
- 5727 N Fillmore St
- 5732 Taylor St
- 5807 N Fillmore St
- 5802 Taylor St
- 5721 N Fillmore St
- 5726 Taylor St
- 5732 N Fillmore St
- 5808 Taylor St
- 5802 N Fillmore St
- 5718 Taylor St
- 5813 N Fillmore St
- 5713 N Fillmore St
- 5808 N Fillmore St
- 1405 W 58th Ct
- 5814 Taylor St
- 5712 Taylor St
- 1414 W 58th Ct
- 5814 N Fillmore St
- 5821 N Fillmore St