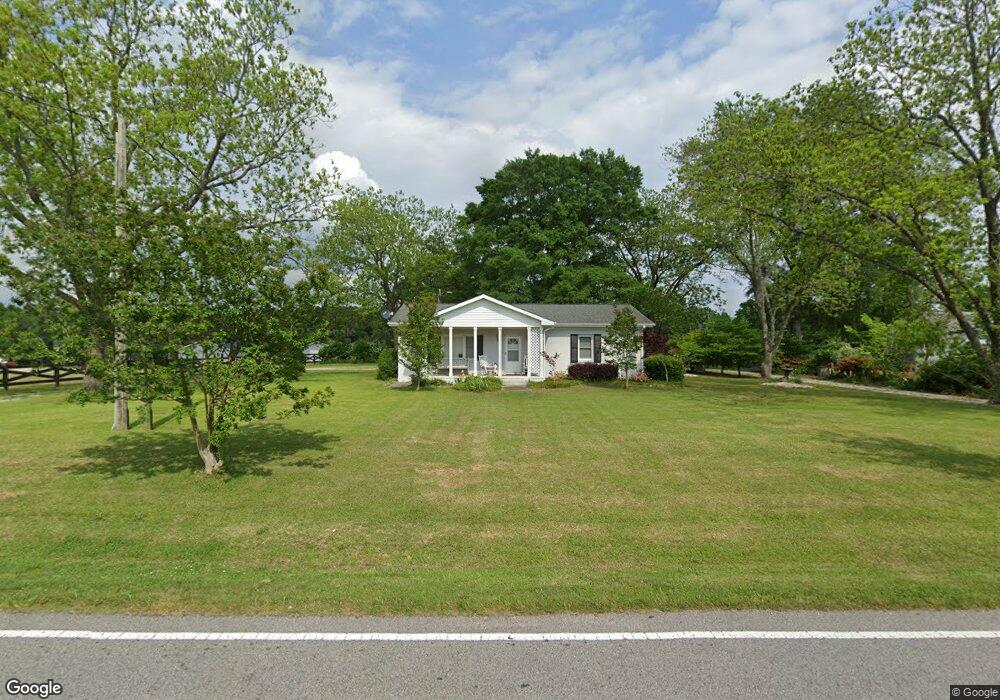
5733 Rock Service Station Rd Raleigh, NC 27603
Estimated Value: $326,000 - $366,000
--
Bed
1
Bath
1,554
Sq Ft
$219/Sq Ft
Est. Value
About This Home
This home is located at 5733 Rock Service Station Rd, Raleigh, NC 27603 and is currently estimated at $340,649, approximately $219 per square foot. 5733 Rock Service Station Rd is a home located in Wake County with nearby schools including Rand Road Elementary, North Garner Middle, and Garner High.
Ownership History
Date
Name
Owned For
Owner Type
Purchase Details
Closed on
May 31, 2023
Sold by
Woodlief Meredith Davis and Woodlief John Wallace
Bought by
Woodlief John Wallace and Woodlief Meredith Davis
Current Estimated Value
Purchase Details
Closed on
Nov 9, 2007
Sold by
Stevens William E and Stevens Sue R
Bought by
The Korbin Group Inc
Home Financials for this Owner
Home Financials are based on the most recent Mortgage that was taken out on this home.
Original Mortgage
$325,000
Interest Rate
6.37%
Mortgage Type
Purchase Money Mortgage
Purchase Details
Closed on
Mar 3, 2004
Sold by
Woodlief Meredith Davis
Bought by
Woodlief John Wallace and Woodlief Meredith Davis
Purchase Details
Closed on
Nov 28, 2000
Sold by
Davis Wyatt Bobbitt
Bought by
Woodlief Meredith Davis
Create a Home Valuation Report for This Property
The Home Valuation Report is an in-depth analysis detailing your home's value as well as a comparison with similar homes in the area
Home Values in the Area
Average Home Value in this Area
Purchase History
| Date | Buyer | Sale Price | Title Company |
|---|---|---|---|
| Woodlief John Wallace | -- | None Listed On Document | |
| The Korbin Group Inc | $350,000 | None Available | |
| Woodlief John Wallace | -- | -- | |
| Woodlief Meredith Davis | -- | -- |
Source: Public Records
Mortgage History
| Date | Status | Borrower | Loan Amount |
|---|---|---|---|
| Previous Owner | The Korbin Group Inc | $325,000 |
Source: Public Records
Tax History Compared to Growth
Tax History
| Year | Tax Paid | Tax Assessment Tax Assessment Total Assessment is a certain percentage of the fair market value that is determined by local assessors to be the total taxable value of land and additions on the property. | Land | Improvement |
|---|---|---|---|---|
| 2025 | $1,572 | $242,624 | $140,000 | $102,624 |
| 2024 | $1,527 | $242,624 | $140,000 | $102,624 |
| 2023 | $1,339 | $169,211 | $70,400 | $98,811 |
| 2022 | $1,242 | $169,211 | $70,400 | $98,811 |
| 2021 | $1,209 | $169,211 | $70,400 | $98,811 |
| 2020 | $1,189 | $169,211 | $70,400 | $98,811 |
| 2019 | $1,123 | $135,036 | $65,800 | $69,236 |
| 2018 | $1,033 | $135,036 | $65,800 | $69,236 |
| 2017 | $980 | $135,036 | $65,800 | $69,236 |
| 2016 | $955 | $134,229 | $65,800 | $68,429 |
| 2015 | $957 | $134,871 | $64,000 | $70,871 |
| 2014 | -- | $134,871 | $64,000 | $70,871 |
Source: Public Records
Map
Nearby Homes
- 1220 Turner Woods Dr
- 1005 Turner Meadow Dr
- 1017 Widgeon Way
- 936 Elbridge Dr
- 1017 Azalea Garden Cir
- 1025 Azalea Garden Cir
- 5512 Glenhurst Dr N
- 1033 Azalea Garden Cir
- 1200 Misty Morning Way
- 1037 Azalea Garden Cir
- 1041 Azalea Garden Cir
- 1045 Azalea Garden Cir
- 6521 Camellia Creek Dr
- 1053 Azalea Garden Cir
- 1057 Azalea Garden Cir
- 1061 Azalea Garden Cir
- 6024 Lunenburg Dr
- 2400 Trueway Ln
- 2817 Buckboard Ln
- 1009 Feldmen Dr
- 5721 Rock Service Station Rd
- 1340 Turner Woods Dr Unit 48
- 1340 Turner Woods Dr
- 5801 Rock Service Station Rd
- 5801 Rock Service Station Rd
- 800 Elbridge Dr
- 1336 Turner Woods Dr
- 1336 Turner Woods Dr Unit Lt 47
- 1337 Turner Woods Dr Unit 49
- 804 Elbridge Dr
- 808 Elbridge Dr
- 1332 Turner Woods Dr
- 5700 Rock Service Station Rd
- 812 Elbridge Dr
- 801 Elbridge Dr
- 5817 Rock Service Station Rd
- 1328 Turner Woods Dr
- 816 Elbridge Dr
- 5828 Turner Store Ln
- 5828 Turner Store Ln Unit Lt120