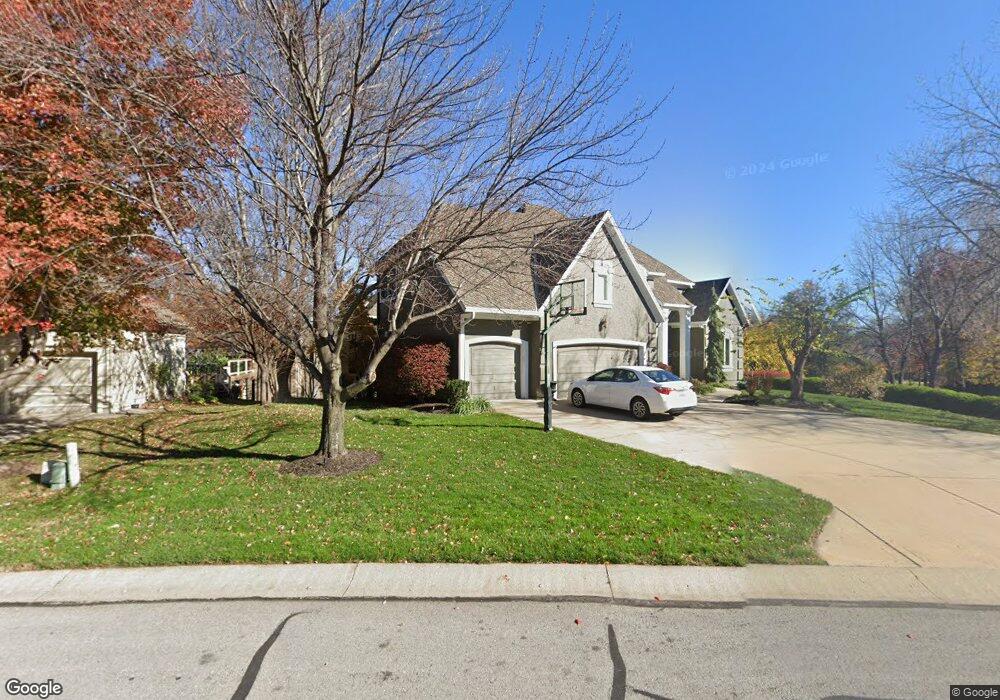
5733 Spinnaker Point Parkville, MO 64152
Estimated Value: $734,943 - $835,000
5
Beds
6
Baths
3,780
Sq Ft
$208/Sq Ft
Est. Value
About This Home
This home is located at 5733 Spinnaker Point, Parkville, MO 64152 and is currently estimated at $785,986, approximately $207 per square foot. 5733 Spinnaker Point is a home located in Platte County with nearby schools including English Landing Elementary School, Lakeview Middle School, and Plaza Middle School.
Ownership History
Date
Name
Owned For
Owner Type
Purchase Details
Closed on
Dec 23, 2015
Sold by
Andrews Hugh Jason and Andrews Sarah E
Bought by
Andrew Hugh Jason
Current Estimated Value
Home Financials for this Owner
Home Financials are based on the most recent Mortgage that was taken out on this home.
Original Mortgage
$417,000
Outstanding Balance
$322,791
Interest Rate
3.25%
Mortgage Type
Adjustable Rate Mortgage/ARM
Estimated Equity
$463,195
Purchase Details
Closed on
Dec 27, 2013
Sold by
Andrews H Jason and Andrews Sarah E
Bought by
Andrews Hugh Jason
Purchase Details
Closed on
May 22, 2007
Sold by
Feitx Dianna R
Bought by
Andrews H Jason
Home Financials for this Owner
Home Financials are based on the most recent Mortgage that was taken out on this home.
Original Mortgage
$390,000
Interest Rate
6.22%
Mortgage Type
New Conventional
Create a Home Valuation Report for This Property
The Home Valuation Report is an in-depth analysis detailing your home's value as well as a comparison with similar homes in the area
Home Values in the Area
Average Home Value in this Area
Purchase History
| Date | Buyer | Sale Price | Title Company |
|---|---|---|---|
| Andrew Hugh Jason | -- | Accommodation | |
| Andrews Hugh Jason | -- | Platinum Title Llc | |
| Andrews Hugh Jason | -- | None Available | |
| Andrews H Jason | -- | None Available |
Source: Public Records
Mortgage History
| Date | Status | Borrower | Loan Amount |
|---|---|---|---|
| Open | Andrews Hugh Jason | $417,000 | |
| Closed | Andrews H Jason | $390,000 |
Source: Public Records
Tax History Compared to Growth
Tax History
| Year | Tax Paid | Tax Assessment Tax Assessment Total Assessment is a certain percentage of the fair market value that is determined by local assessors to be the total taxable value of land and additions on the property. | Land | Improvement |
|---|---|---|---|---|
| 2024 | $8,692 | $107,889 | $18,697 | $89,192 |
| 2023 | $8,692 | $107,889 | $18,697 | $89,192 |
| 2022 | $8,317 | $101,878 | $18,697 | $83,181 |
| 2021 | $8,341 | $101,878 | $18,697 | $83,181 |
| 2020 | $7,545 | $90,109 | $14,731 | $75,378 |
| 2019 | $7,545 | $90,109 | $14,731 | $75,378 |
| 2018 | $7,185 | $84,657 | $12,350 | $72,307 |
| 2017 | $7,156 | $84,657 | $12,350 | $72,307 |
| 2016 | $7,271 | $84,657 | $12,350 | $72,307 |
| 2015 | $7,306 | $84,657 | $12,350 | $72,307 |
| 2013 | $7,113 | $84,657 | $0 | $0 |
Source: Public Records
Map
Nearby Homes
- 5527 NW Oakdale Place
- 5733 NW North Pointe Terrace
- 5829 Manor Ln
- 8000 NW Timbercrest Place
- 6004 Westshore Ct
- 8190 Shoreline Dr
- 6006 W Shore Ct
- 5751 Lentz Dr
- 6325 Edgewater Dr
- Madison IV Plan at Riss Lake - The Sanctuary
- Courtland Reverse Plan at Riss Lake - The Sanctuary
- Brookridge IV Plan at Riss Lake - The Sanctuary
- 5842 N Lucerne Ave
- 5830 N Lucerne Ave
- 6216 NW 59th Terrace
- 5907 N Lucerne Ave
- 8140 Westlake Dr
- 8170 Westlake Dr
- 8200 W Lake Dr
- The York Plan at The Preserve at Forest Ridge Estates - Forest Ridge Estates
- 5832 NW Hickory Place
- 5737 Spinnaker Point
- 5729 Willow Ct
- 5709 Spinnaker Point
- 5736 Spinnaker Point
- 5732 Spinnaker Point
- 5713 Willow Ct
- 5741 Spinnaker Point
- 5725 Willow Ct
- 5728 Spinnaker Point
- 5705 Spinnaker Point
- 5745 NW Hickory Ct
- 5740 Spinnaker Point
- 5800 NW Spinnaker Pointe N A
- 5724 Willow Place
- 5721 Willow Ct
- 5704 Spinnaker Point
- 5749 NW Hickory Ct
- 5800 Spinnaker Point
- 5801 Spinnaker Point