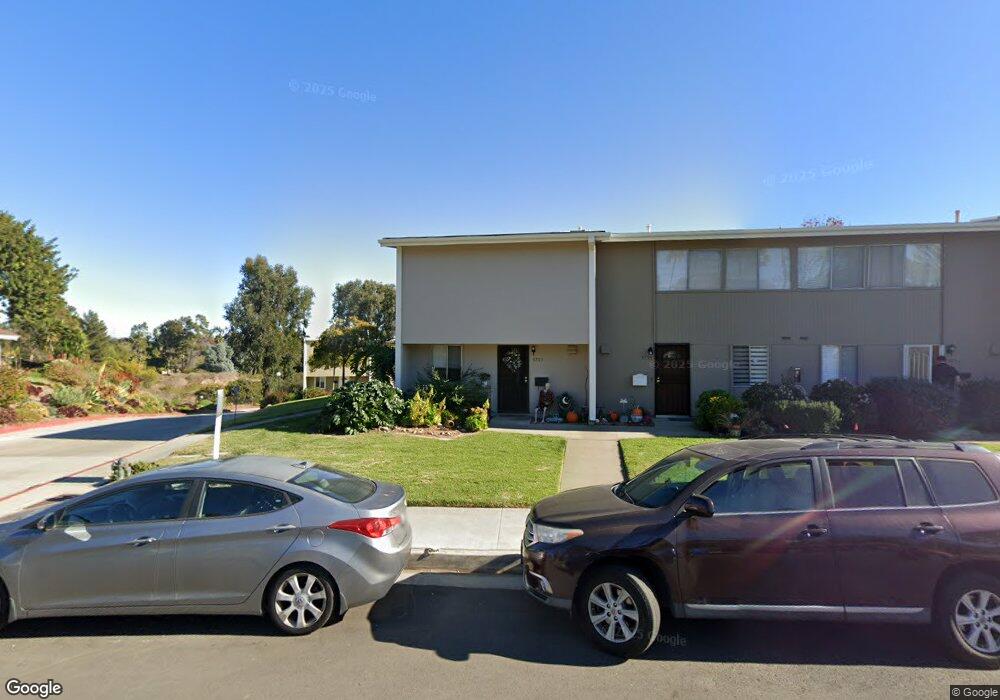
5735 Erlanger St San Diego, CA 92122
University City NeighborhoodEstimated Value: $709,000 - $940,000
3
Beds
2
Baths
1,273
Sq Ft
$635/Sq Ft
Est. Value
About This Home
This home is located at 5735 Erlanger St, San Diego, CA 92122 and is currently estimated at $808,691, approximately $635 per square foot. 5735 Erlanger St is a home located in San Diego County with nearby schools including Marie Curie Elementary School, Standley Middle School, and University City High School.
Ownership History
Date
Name
Owned For
Owner Type
Purchase Details
Closed on
Mar 4, 2021
Sold by
Yarkony Julian Elliot and Yarkony Julian E
Bought by
Yarkony Julian Elliot
Current Estimated Value
Home Financials for this Owner
Home Financials are based on the most recent Mortgage that was taken out on this home.
Original Mortgage
$382,500
Outstanding Balance
$342,884
Interest Rate
2.7%
Mortgage Type
New Conventional
Estimated Equity
$465,807
Purchase Details
Closed on
Dec 14, 2015
Sold by
Thomas Tammy J
Bought by
Yarkony Julian E
Home Financials for this Owner
Home Financials are based on the most recent Mortgage that was taken out on this home.
Original Mortgage
$370,500
Interest Rate
3.94%
Mortgage Type
New Conventional
Purchase Details
Closed on
Dec 23, 2014
Sold by
Thomas Tammy J
Bought by
Tammy J Thomas Trust
Purchase Details
Closed on
Jan 30, 1991
Bought by
Kroll Charles P Tammy J
Create a Home Valuation Report for This Property
The Home Valuation Report is an in-depth analysis detailing your home's value as well as a comparison with similar homes in the area
Home Values in the Area
Average Home Value in this Area
Purchase History
| Date | Buyer | Sale Price | Title Company |
|---|---|---|---|
| Yarkony Julian Elliot | -- | Wfg Title Co Of Ca San Diego | |
| Yarkony Julian E | $390,000 | Fidelity Title | |
| Tammy J Thomas Trust | -- | None Available | |
| Thomas Tammy J | -- | None Available | |
| Kroll Charles P Tammy J | $140,000 | -- |
Source: Public Records
Mortgage History
| Date | Status | Borrower | Loan Amount |
|---|---|---|---|
| Open | Yarkony Julian Elliot | $382,500 | |
| Previous Owner | Yarkony Julian E | $370,500 |
Source: Public Records
Tax History Compared to Growth
Tax History
| Year | Tax Paid | Tax Assessment Tax Assessment Total Assessment is a certain percentage of the fair market value that is determined by local assessors to be the total taxable value of land and additions on the property. | Land | Improvement |
|---|---|---|---|---|
| 2025 | $5,601 | $461,674 | $307,783 | $153,891 |
| 2024 | $5,601 | $452,623 | $301,749 | $150,874 |
| 2023 | $5,477 | $443,749 | $295,833 | $147,916 |
| 2022 | $5,332 | $435,049 | $290,033 | $145,016 |
| 2021 | $5,295 | $426,520 | $284,347 | $142,173 |
| 2020 | $5,231 | $422,148 | $281,432 | $140,716 |
| 2019 | $5,138 | $413,871 | $275,914 | $137,957 |
| 2018 | $4,804 | $405,756 | $270,504 | $135,252 |
| 2017 | $4,691 | $397,800 | $265,200 | $132,600 |
| 2016 | $2,541 | $213,286 | $73,716 | $139,570 |
| 2015 | $2,503 | $210,083 | $72,609 | $137,474 |
| 2014 | $2,465 | $205,969 | $71,187 | $134,782 |
Source: Public Records
Map
Nearby Homes
- 5977 Erlanger St
- 5889 Cozzens St
- 5962 Agee St
- 4612 Benhurst Ave
- 5448 Noah Way
- 5021 Via Cinta
- 6214 Agee St Unit 34
- 5192 Providence Rd
- 5257 Cole St
- 6188 Agee St Unit 230
- 5266 Diane Ave
- 6330 Genesee Ave Unit 112
- 6330 Genesee Ave Unit 220
- 6330 Genesee Ave Unit 213
- 5738 Lodi St
- 3598 Syracuse Ave
- 4972 Ensign St
- 4635 Pauling Ave
- 4282 Robbins St
- 6174 Syracuse Way
- 5737 Erlanger St
- 5739 Erlanger St
- 5733 Erlanger St
- 5741 Erlanger St
- 5741 Erlanger St Unit 85
- 5731 Erlanger St Unit 90
- 5729 Erlanger St Unit 91
- 5727 Erlanger St Unit 92
- 5757 Erlanger St
- 5755 Erlanger St
- 5753 Erlanger St
- 5725 Erlanger St
- 5761 Erlanger St
- 5723 Erlanger St
- 5749 Erlanger St
- 5721 Erlanger St Unit 95
- 5747 Erlanger St
- 5751 Erlanger St
- 5719 Erlanger St
- 5745 Erlanger St