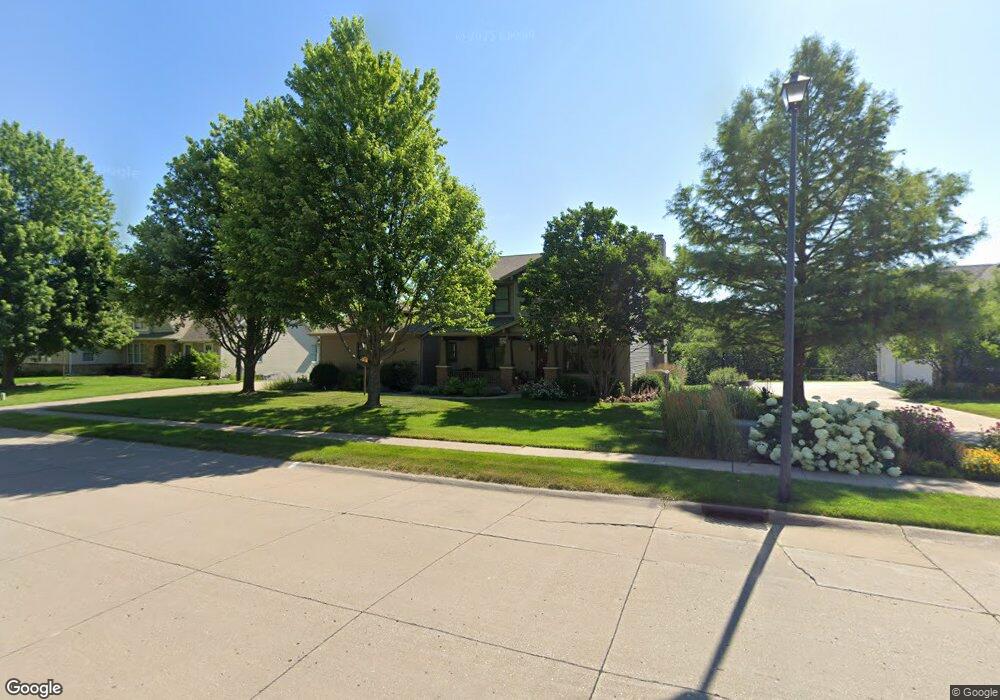
5735 Remington Rd N Bettendorf, IA 52722
Estimated Value: $512,000 - $658,000
4
Beds
4
Baths
2,903
Sq Ft
$211/Sq Ft
Est. Value
About This Home
This home is located at 5735 Remington Rd N, Bettendorf, IA 52722 and is currently estimated at $612,063, approximately $210 per square foot. 5735 Remington Rd N is a home located in Scott County with nearby schools including Pleasant View Elementary, Pleasant Valley Junior High School, and Pleasant Valley High School.
Ownership History
Date
Name
Owned For
Owner Type
Purchase Details
Closed on
Aug 7, 2009
Sold by
Ites Aaron D and Ites Elizabeth K
Bought by
Frink Ian A and Frink Monique R
Current Estimated Value
Home Financials for this Owner
Home Financials are based on the most recent Mortgage that was taken out on this home.
Original Mortgage
$360,000
Interest Rate
5.01%
Mortgage Type
New Conventional
Purchase Details
Closed on
May 11, 2007
Sold by
Windmiller Design & Development Co
Bought by
Ites Aaron D and Ites Elizabeth K
Home Financials for this Owner
Home Financials are based on the most recent Mortgage that was taken out on this home.
Original Mortgage
$355,000
Interest Rate
6.27%
Mortgage Type
New Conventional
Create a Home Valuation Report for This Property
The Home Valuation Report is an in-depth analysis detailing your home's value as well as a comparison with similar homes in the area
Home Values in the Area
Average Home Value in this Area
Purchase History
| Date | Buyer | Sale Price | Title Company |
|---|---|---|---|
| Frink Ian A | $450,000 | None Available | |
| Ites Aaron D | $489,000 | None Available |
Source: Public Records
Mortgage History
| Date | Status | Borrower | Loan Amount |
|---|---|---|---|
| Previous Owner | Frink Ian A | $360,000 | |
| Previous Owner | Ites Aaron D | $355,000 |
Source: Public Records
Tax History Compared to Growth
Tax History
| Year | Tax Paid | Tax Assessment Tax Assessment Total Assessment is a certain percentage of the fair market value that is determined by local assessors to be the total taxable value of land and additions on the property. | Land | Improvement |
|---|---|---|---|---|
| 2025 | $8,234 | $618,200 | $129,100 | $489,100 |
| 2024 | $8,358 | $545,100 | $104,400 | $440,700 |
| 2023 | $8,334 | $545,100 | $104,400 | $440,700 |
| 2022 | $8,248 | $466,970 | $104,400 | $362,570 |
| 2021 | $8,248 | $466,970 | $104,400 | $362,570 |
| 2020 | $8,448 | $461,830 | $104,400 | $357,430 |
| 2019 | $8,554 | $461,830 | $104,400 | $357,430 |
| 2018 | $8,386 | $461,830 | $104,400 | $357,430 |
| 2017 | $2,569 | $461,830 | $104,400 | $357,430 |
| 2016 | $8,582 | $464,750 | $0 | $0 |
| 2015 | $8,582 | $447,620 | $0 | $0 |
| 2014 | $8,368 | $447,620 | $0 | $0 |
| 2013 | $8,220 | $0 | $0 | $0 |
| 2012 | -- | $450,970 | $122,100 | $328,870 |
Source: Public Records
Map
Nearby Homes
- 5885 Remington Rd N
- The Harrington Plan at Hopewell Farms
- The Arlington Plan at Hopewell Farms
- The Lexington Plan at Hopewell Farms
- The Charleston Plan at Hopewell Farms
- 5937 Butterfield Ct
- 5922 Butterfield Ct
- 5900 Butterfield Ct
- 5882 Butterfield Ct
- 5919 Butterfield Dr
- 5885 Butterfield Dr
- 5925 Butterfield Dr
- 5931 Butterfield Dr
- 5882 Butterfield Dr
- 6015 Ryan Ct
- Lot 51 Polster Place
- 5900 Butterfield Dr
- 5934 Butterfield Dr
- Lot 50 Polster Place
- 5922 Butterfield Dr
- 5759 Remington Rd N
- 5721 Remington Rd N
- 5809 Remington Rd N
- 5394 Griffin Ln
- 5689 Remington Rd N
- 5719 Remington Rd N
- 5393 Griffin Ln
- 5857 Remington Rd N
- 5393 Hopewell Ct
- 5382 Griffin Ln
- 5655 Remington Rd N
- 5381 Griffin Ln
- 5768 New Castle Ln
- 5676 Remington Rd N
- 5371 Hopewell Ct
- 5368 Griffin Ln
- 5695 Remington Rd N
- 5601 Remington Rd N
- 5359 Griffin Ln
- 5888 Remington Rd N