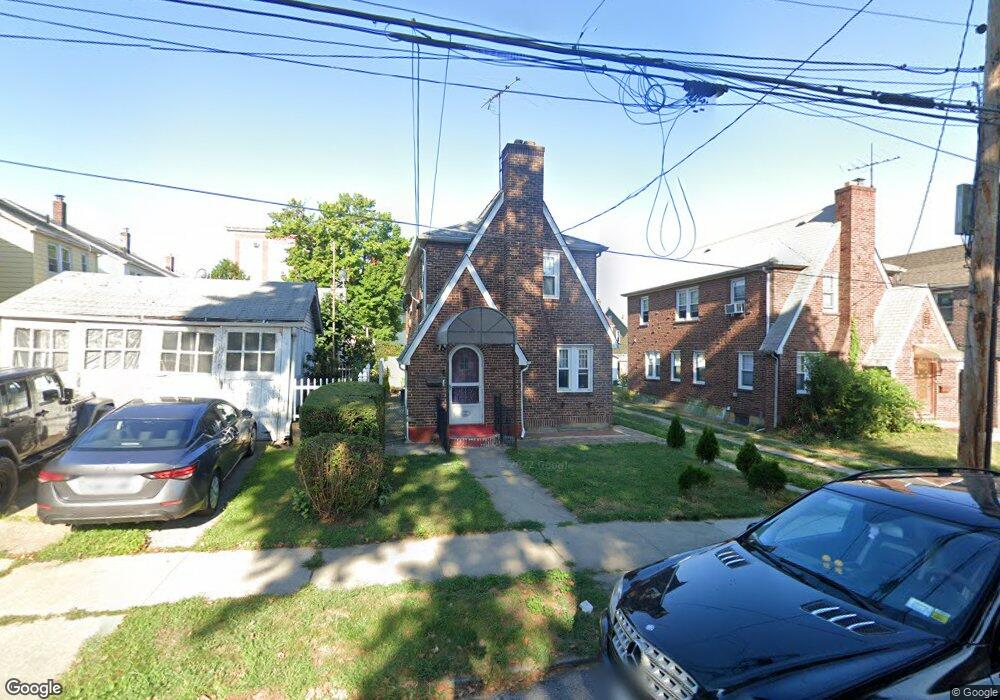
5736 161st St Fresh Meadows, NY 11365
Flushing NeighborhoodEstimated Value: $972,000 - $1,046,000
--
Bed
--
Bath
1,368
Sq Ft
$732/Sq Ft
Est. Value
About This Home
This home is located at 5736 161st St, Fresh Meadows, NY 11365 and is currently estimated at $1,001,294, approximately $731 per square foot. 5736 161st St is a home located in Queens County with nearby schools including P.S. 163 - Flushing Heights, Rachel Carson I.S. 237Q, and Francis Lewis High School.
Ownership History
Date
Name
Owned For
Owner Type
Purchase Details
Closed on
Mar 21, 2024
Sold by
Chu Koon Fuk and Liu Wan Kun
Bought by
Chu Farrah and Chu Koon Fuk
Current Estimated Value
Purchase Details
Closed on
Nov 30, 2006
Sold by
Libonati Danny G and Libonati Marianne
Bought by
Chu Koon Fuk and Liu Wan Kun
Home Financials for this Owner
Home Financials are based on the most recent Mortgage that was taken out on this home.
Original Mortgage
$413,000
Outstanding Balance
$246,924
Interest Rate
6.31%
Mortgage Type
Purchase Money Mortgage
Estimated Equity
$754,370
Purchase Details
Closed on
Jan 29, 1999
Sold by
Dangelo Michael J and Dangelo Barbara
Bought by
Libonati Danny G and Libonati Marianne
Home Financials for this Owner
Home Financials are based on the most recent Mortgage that was taken out on this home.
Original Mortgage
$227,000
Interest Rate
6.83%
Mortgage Type
Purchase Money Mortgage
Create a Home Valuation Report for This Property
The Home Valuation Report is an in-depth analysis detailing your home's value as well as a comparison with similar homes in the area
Home Values in the Area
Average Home Value in this Area
Purchase History
| Date | Buyer | Sale Price | Title Company |
|---|---|---|---|
| Chu Farrah | -- | -- | |
| Chu Farrah | -- | -- | |
| Chu Koon Fuk | $590,000 | -- | |
| Chu Koon Fuk | $590,000 | -- | |
| Libonati Danny G | $260,000 | -- | |
| Libonati Danny G | $260,000 | -- |
Source: Public Records
Mortgage History
| Date | Status | Borrower | Loan Amount |
|---|---|---|---|
| Open | Chu Koon Fuk | $413,000 | |
| Closed | Chu Koon Fuk | $413,000 | |
| Previous Owner | Libonati Danny G | $227,000 |
Source: Public Records
Tax History Compared to Growth
Tax History
| Year | Tax Paid | Tax Assessment Tax Assessment Total Assessment is a certain percentage of the fair market value that is determined by local assessors to be the total taxable value of land and additions on the property. | Land | Improvement |
|---|---|---|---|---|
| 2025 | $8,549 | $45,074 | $11,066 | $34,008 |
| 2024 | $8,549 | $42,564 | $10,577 | $31,987 |
| 2023 | $8,117 | $40,415 | $11,096 | $29,319 |
| 2022 | $7,771 | $56,460 | $14,760 | $41,700 |
| 2021 | $8,052 | $54,360 | $14,760 | $39,600 |
| 2020 | $7,951 | $55,980 | $14,760 | $41,220 |
| 2019 | $7,240 | $55,380 | $14,760 | $40,620 |
| 2018 | $6,865 | $33,679 | $9,898 | $23,781 |
| 2017 | $6,500 | $31,886 | $9,793 | $22,093 |
| 2016 | $6,374 | $31,886 | $9,793 | $22,093 |
| 2015 | $3,628 | $31,302 | $13,918 | $17,384 |
| 2014 | $3,628 | $29,559 | $13,316 | $16,243 |
Source: Public Records
Map
Nearby Homes
- 159-08 59th Ave
- 160-12 Booth Memorial Ave
- 57-19 Parsons Blvd
- 5944 159th St
- 5728 Parsons Blvd Unit Front
- 57-12 164th St
- 61-27 160 St
- 59-39 156th St
- 6126 164th St
- 6133 157th St
- 16216 65th Ave
- 156-14 65th Ave
- 155-17 65th Ave
- 154-39 64th Ave
- 64-12 155th St
- 153-40 58th Ave
- 54-30 Kissena Blvd
- 153-51 Horace Harding Expy
- 15308 58th Rd
- 54-23 153rd St
- 5736 161st St
- 5736 161st St Unit 1st Fl
- 5732 161st St
- 16015 59th Ave
- 5730 161st St
- 16017 59th Ave
- 16011 59th Ave
- 57-30 161st St
- 16009 59th Ave
- 5737 160th St
- 5735 160th St
- 16007 59th Ave
- 5733 160th St
- 5726 161st St
- 57-29 160th St
- 5729 160th St
- 57-26 161st St Unit 1Fl
- 57-26 161st St
- 5726 161st St Unit 1Fl
- 16005 59th Ave