5738 4th St NE Minneapolis, MN 55432
Bonny NeighborhoodEstimated Value: $262,000 - $267,000
2
Beds
2
Baths
1,339
Sq Ft
$197/Sq Ft
Est. Value
About This Home
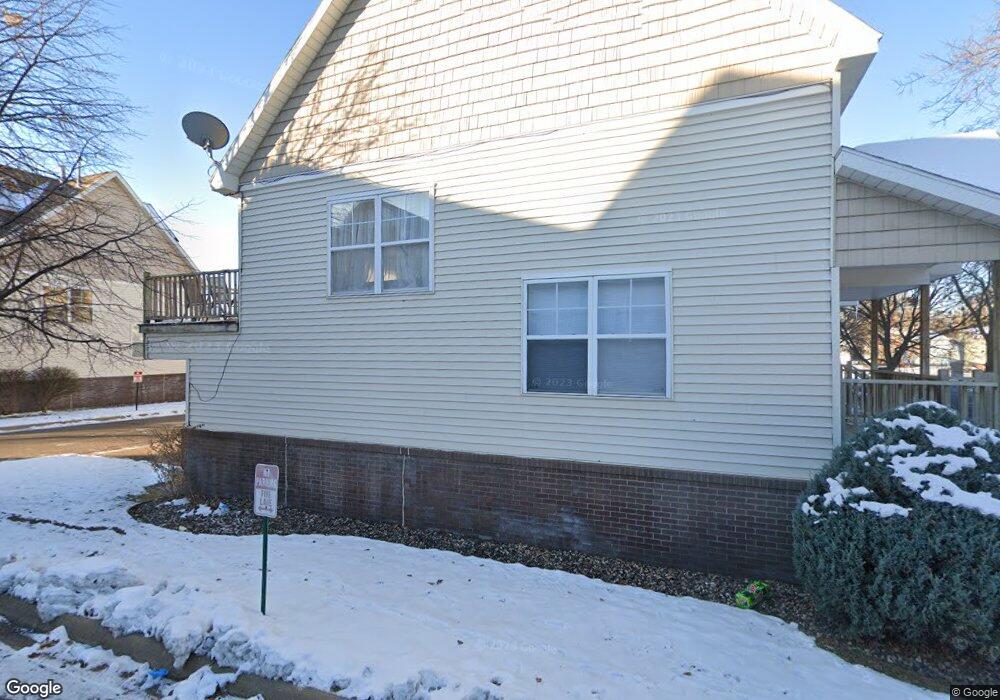
This home is located at 5738 4th St NE, Minneapolis, MN 55432 and is currently estimated at $264,197, approximately $197 per square foot. 5738 4th St NE is a home located in Anoka County with nearby schools including Stevenson Elementary School, Fridley Middle School, and Fridley Senior High School.
Ownership History
Date
Name
Owned For
Owner Type
Purchase Details
Closed on
Aug 17, 2017
Sold by
Cornilsen Chelsy L and Cornilsen Joel
Bought by
Benti Kaku Asfaw
Current Estimated Value
Home Financials for this Owner
Home Financials are based on the most recent Mortgage that was taken out on this home.
Original Mortgage
$170,041
Outstanding Balance
$141,886
Interest Rate
3.96%
Mortgage Type
New Conventional
Estimated Equity
$122,311
Purchase Details
Closed on
Aug 15, 2017
Sold by
Welsh Richrd A and Welsh Stacy Ann
Bought by
Cornilsen Chelsy L and Cornilsen Joel
Home Financials for this Owner
Home Financials are based on the most recent Mortgage that was taken out on this home.
Original Mortgage
$170,041
Outstanding Balance
$141,886
Interest Rate
3.96%
Mortgage Type
New Conventional
Estimated Equity
$122,311
Purchase Details
Closed on
Jul 28, 2006
Sold by
Blumhoefer Kate and Blumhoefer Kate
Bought by
Welsh Richard A and Welsh Chelsy L
Purchase Details
Closed on
May 24, 2002
Sold by
Gateway East Redevelopment Llc
Bought by
Blumhoefer Todd and Herges Kate
Create a Home Valuation Report for This Property
The Home Valuation Report is an in-depth analysis detailing your home's value as well as a comparison with similar homes in the area
Home Values in the Area
Average Home Value in this Area
Purchase History
| Date | Buyer | Sale Price | Title Company |
|---|---|---|---|
| Benti Kaku Asfaw | $175,300 | Minnesota Title | |
| Cornilsen Chelsy L | -- | Minnesota Title | |
| Welsh Richard A | $197,500 | -- | |
| Blumhoefer Todd | $168,590 | -- |
Source: Public Records
Mortgage History
| Date | Status | Borrower | Loan Amount |
|---|---|---|---|
| Open | Benti Kaku Asfaw | $170,041 |
Source: Public Records
Tax History Compared to Growth
Tax History
| Year | Tax Paid | Tax Assessment Tax Assessment Total Assessment is a certain percentage of the fair market value that is determined by local assessors to be the total taxable value of land and additions on the property. | Land | Improvement |
|---|---|---|---|---|
| 2025 | $3,274 | $238,100 | $38,100 | $200,000 |
| 2024 | $3,274 | $251,200 | $50,100 | $201,100 |
| 2023 | $2,684 | $221,000 | $40,100 | $180,900 |
| 2022 | $2,721 | $227,900 | $38,100 | $189,800 |
| 2021 | $2,646 | $202,000 | $22,300 | $179,700 |
| 2020 | $2,454 | $195,800 | $26,000 | $169,800 |
| 2019 | $2,220 | $176,700 | $23,700 | $153,000 |
| 2018 | $2,226 | $163,200 | $0 | $0 |
| 2017 | $2,378 | $158,400 | $0 | $0 |
| 2016 | $2,258 | $135,000 | $0 | $0 |
| 2015 | -- | $135,000 | $12,000 | $123,000 |
| 2014 | -- | $116,600 | $11,000 | $105,600 |
Source: Public Records
Map
Nearby Homes
- 5724 4th St NE
- 5751 7th St NE
- 5820 2 1 2 St NE
- 610 57th Ave NE
- 650 58th Ave NE
- 655 57th Ave NE
- 6120 7th St NE
- 5724 W Moore Lake Dr NE
- 5207 7th St NE
- 6231 Trinity Dr NE
- 261 Sylvan Ln NE
- 6231 Starlite Blvd NE
- 524 63rd Ave NE
- 613 Sullivan Dr NE
- 5730 Polk St NE
- 211 Christenson Way NE
- 6220 Carol Dr NE
- 6360 Madison St NE
- 5006 6th St NE
- 6422 Starlite Cir NE
- 5736 4th St NE
- 5734 4th St NE
- 5718 4th St NE
- 5748 4th St NE
- 5746 4th St NE
- 5732 4th St NE
- 5744 4th St NE
- 5716 4th St NE
- 5742 4th St NE
- 5730 4th St NE
- 5740 4th St NE
- 5714 4th St NE
- 5714 4th St NE
- 5728 4th St NE
- 5801 University Ave NE
- 5720 4th St NE
- 5722 4th St NE
- 5803 University Ave NE
- 5712 4th St NE
- 5805 University Ave NE