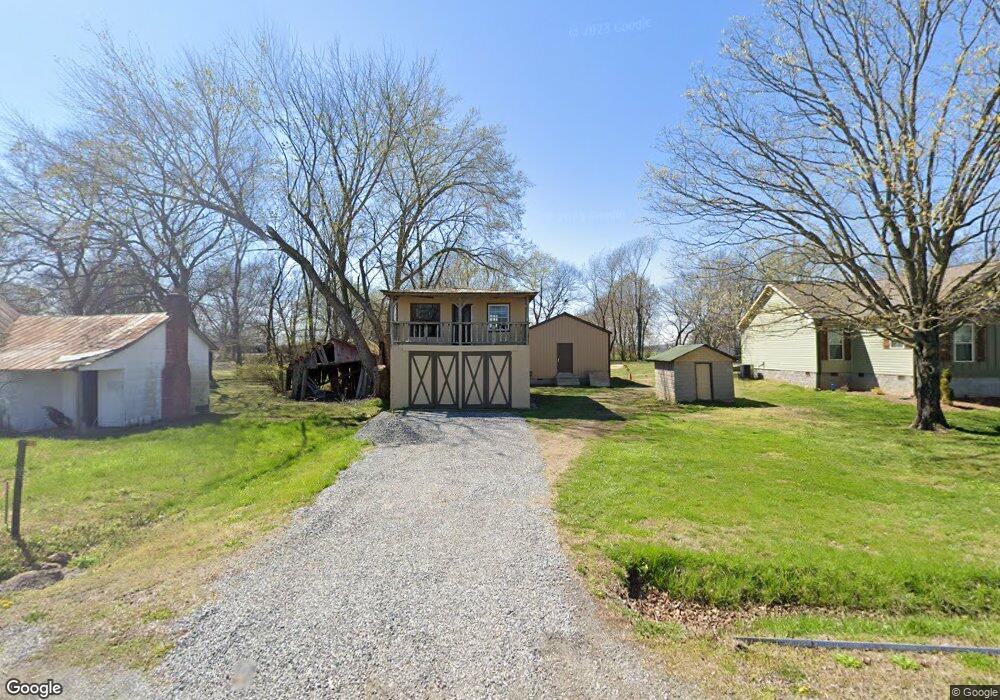
5738 Highway 161 Springfield, TN 37172
Estimated Value: $316,000 - $405,000
--
Bed
--
Bath
1,000
Sq Ft
$344/Sq Ft
Est. Value
About This Home
This home is located at 5738 Highway 161, Springfield, TN 37172 and is currently estimated at $343,545, approximately $343 per square foot. 5738 Highway 161 is a home located in Robertson County with nearby schools including Cheatham Park Elementary School, Westside Elementary School, and Innovation Academy.
Ownership History
Date
Name
Owned For
Owner Type
Purchase Details
Closed on
Dec 1, 2022
Sold by
Wingo Tucker
Bought by
Indigo Alison Leslie
Current Estimated Value
Purchase Details
Closed on
Oct 15, 2021
Sold by
Smith David M and Smith Karen L
Bought by
Wingo Tucker and Signoracci Courtney
Purchase Details
Closed on
Apr 1, 2005
Sold by
Hall Paul
Bought by
Smith David M and Smith Karen L
Purchase Details
Closed on
Feb 2, 2004
Sold by
Sneed Robert W Revocable L
Bought by
Hall Paul
Purchase Details
Closed on
Dec 22, 2003
Sold by
Sneed Robert W
Bought by
Sneed Robert Revocable Living
Purchase Details
Closed on
Sep 15, 2003
Sold by
King Marcie L
Bought by
Sneed Robert W
Purchase Details
Closed on
Jun 14, 1990
Bought by
Chandler Del
Purchase Details
Closed on
Jan 13, 1987
Bought by
Colson Calvin D and Colson Cassy R
Create a Home Valuation Report for This Property
The Home Valuation Report is an in-depth analysis detailing your home's value as well as a comparison with similar homes in the area
Home Values in the Area
Average Home Value in this Area
Purchase History
| Date | Buyer | Sale Price | Title Company |
|---|---|---|---|
| Indigo Alison Leslie | -- | Greater Nashville Title | |
| Wingo Tucker | -- | Tennessee Title | |
| Smith David M | -- | -- | |
| Hall Paul | $7,000 | -- | |
| Sneed Robert Revocable Living | -- | -- | |
| Sneed Robert W | $8,000 | -- | |
| Chandler Del | -- | -- | |
| Colson Calvin D | -- | -- |
Source: Public Records
Tax History Compared to Growth
Tax History
| Year | Tax Paid | Tax Assessment Tax Assessment Total Assessment is a certain percentage of the fair market value that is determined by local assessors to be the total taxable value of land and additions on the property. | Land | Improvement |
|---|---|---|---|---|
| 2025 | $360 | $19,975 | $0 | $0 |
| 2024 | $360 | $19,975 | $13,750 | $6,225 |
| 2023 | $360 | $19,975 | $13,750 | $6,225 |
| 2022 | $204 | $7,925 | $3,750 | $4,175 |
| 2021 | $204 | $7,925 | $3,750 | $4,175 |
| 2020 | $204 | $7,925 | $3,750 | $4,175 |
| 2019 | $204 | $7,925 | $3,750 | $4,175 |
| 2018 | $204 | $7,925 | $3,750 | $4,175 |
| 2017 | $137 | $4,425 | $1,250 | $3,175 |
| 2016 | $137 | $4,425 | $1,250 | $3,175 |
| 2015 | $131 | $4,425 | $1,250 | $3,175 |
| 2014 | $131 | $4,425 | $1,250 | $3,175 |
Source: Public Records
Map
Nearby Homes
- 5685 Minnis Rd
- 5439 Minnis Rd
- 4413 Taylor Rd
- 4591 Benson Rd
- 4067 Woodard Rd
- 5 Highway161
- 11 Highway161
- 10 Highway161
- 4 Highway161
- 12 Highway161
- 2 Highway161
- 8 Highway161
- 4927 Minnis Rd
- 4785 Pulliam Hardaway Rd
- 5971 Wayman Dunn Rd
- 5440 Eugene Kennedy Ln
- 6023 Wayman Dunn Rd
- 6442 Highway 161
- 6261 H B Lee Rd
- 5988 Buzzard Creek Rd
- 5734 Highway 161
- 5744 Highway 161
- 5743 Highway 161
- 4532 Corbin Sneed Rd
- 4528 Corbin Sneed Rd
- 4524 Corbin Sneed Rd
- 5748 Highway 161
- 4522 Corbin Sneed Rd
- 5718 Highway 161
- 5755 Highway 161
- 4527 Corbin Sneed Rd
- 4402 Barren Plains Rd
- 4406 Barren Plains Rd
- 4435 Barren Plains Rd
- 4426 Barren Plains Rd
- 5712 Highway 161
- 4553 Corbin Sneed Rd
- 5707 Highway 161
- 4563 Corbin Sneed Rd
- 4507 Corbin Sneed Rd