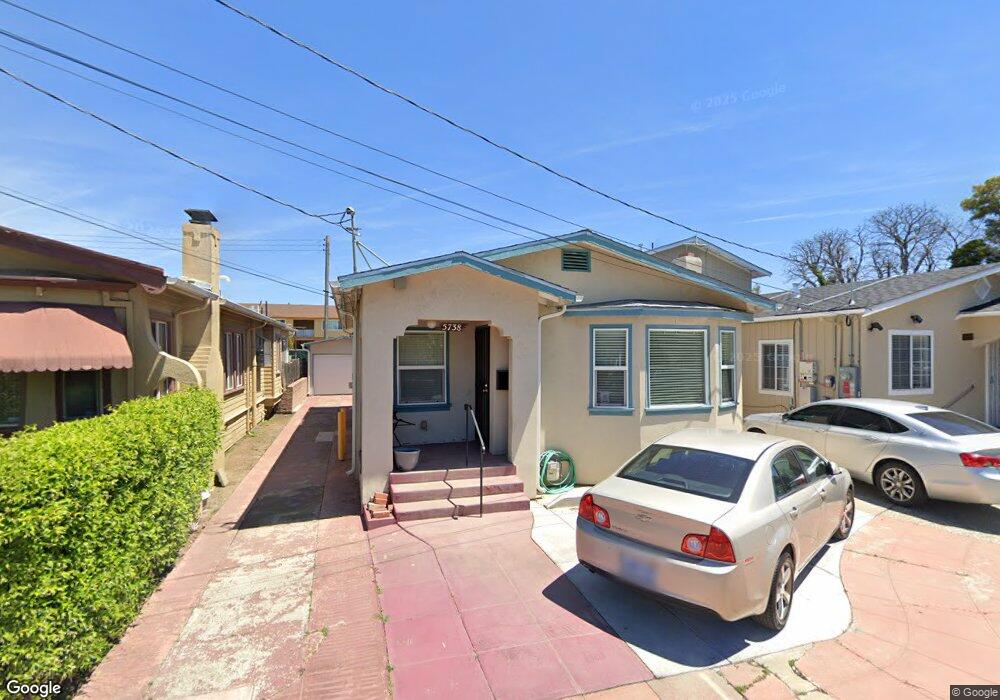
5738 Holway Ct Oakland, CA 94621
Seminary NeighborhoodEstimated Value: $427,033 - $457,000
2
Beds
1
Bath
1,025
Sq Ft
$435/Sq Ft
Est. Value
About This Home
This home is located at 5738 Holway Ct, Oakland, CA 94621 and is currently estimated at $445,758, approximately $434 per square foot. 5738 Holway Ct is a home located in Alameda County with nearby schools including Greenleaf TK-8, Coliseum College Prep Academy, and Fremont High School.
Ownership History
Date
Name
Owned For
Owner Type
Purchase Details
Closed on
Nov 13, 1995
Sold by
Smith Michael L and Smith Cheryl F
Bought by
Ewins Shirley M and Riley Dianne F
Current Estimated Value
Purchase Details
Closed on
Aug 5, 1994
Sold by
Legac Linda M and Munro Michael
Bought by
Jones Rebecca and Jones Eddie Dan
Purchase Details
Closed on
Aug 1, 1994
Sold by
Jones Janelle
Bought by
Jones Eddie Dan
Purchase Details
Closed on
Mar 22, 1994
Sold by
First Capital Finance
Bought by
Legac Linda M and Munro Michael
Create a Home Valuation Report for This Property
The Home Valuation Report is an in-depth analysis detailing your home's value as well as a comparison with similar homes in the area
Home Values in the Area
Average Home Value in this Area
Purchase History
| Date | Buyer | Sale Price | Title Company |
|---|---|---|---|
| Ewins Shirley M | $10,000 | -- | |
| Jones Rebecca | $88,000 | Placer Title Company | |
| Jones Eddie Dan | -- | Placer Title Company | |
| Legac Linda M | $81,841 | Placer Title Company |
Source: Public Records
Tax History Compared to Growth
Tax History
| Year | Tax Paid | Tax Assessment Tax Assessment Total Assessment is a certain percentage of the fair market value that is determined by local assessors to be the total taxable value of land and additions on the property. | Land | Improvement |
|---|---|---|---|---|
| 2025 | $3,458 | $130,391 | $41,150 | $96,241 |
| 2024 | $3,458 | $127,697 | $40,343 | $94,354 |
| 2023 | $3,514 | $132,057 | $39,552 | $92,505 |
| 2022 | $3,354 | $122,468 | $38,777 | $90,691 |
| 2021 | $3,064 | $119,930 | $38,017 | $88,913 |
| 2020 | $3,027 | $125,628 | $37,627 | $88,001 |
| 2019 | $2,823 | $123,165 | $36,889 | $86,276 |
| 2018 | $2,767 | $120,751 | $36,166 | $84,585 |
| 2017 | $2,627 | $118,383 | $35,457 | $82,926 |
| 2016 | $2,453 | $116,063 | $34,762 | $81,301 |
| 2015 | $2,435 | $114,320 | $34,240 | $80,080 |
| 2014 | $2,356 | $112,080 | $33,569 | $78,511 |
Source: Public Records
Map
Nearby Homes
- 2007 57th Ave
- 5800 E 17th St
- 5553 Harvey Ave
- 1604 57th Ave
- 5540 E 17th St
- 1605 57th Ave
- 5715 E 16th St
- 5421 Wentworth Ave
- 6121 Holway St
- 6131 Hayes St
- 5483 Wadean Place
- 5388 Wentworth Ave
- 5444 Bancroft Ave
- 2426 57th Ave
- 5914 International Blvd
- 1424 57th Ave
- 5910 International Blvd
- 5600 Foothill Blvd
- 5431 Ygnacio Ave
- 5315 Cole St
- 5732 Holway Ct
- 5744 Holway Ct
- 5726 Holway Ct
- 5720 Holway Ct
- 2002 57th Ave
- 5714 Holway Ct
- 5739 Holway Ct
- 5733 Holway Ct
- 5745 Holway Ct
- 5727 Holway Ct
- 5721 Holway Ct
- 5708 Holway Ct
- 2016 57th Ave
- 2016 57th Ave Unit 9
- 5715 Holway Ct
- 5709 Holway Ct
- 1926 57th Ave
- 1932 57th Ave
- 2006 57th Ave
- 5737 Harmon Ave