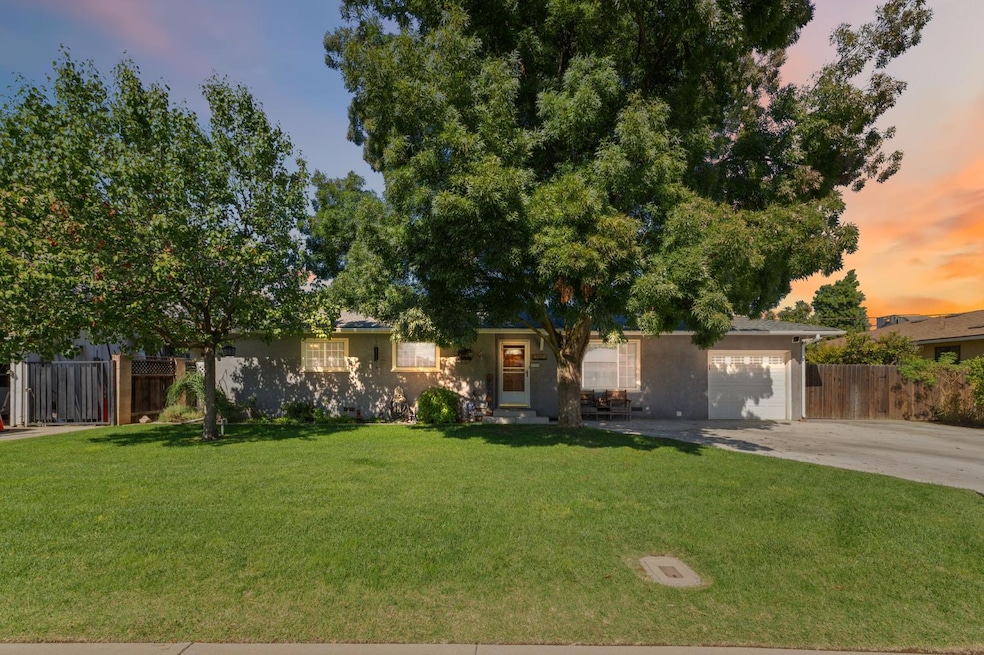
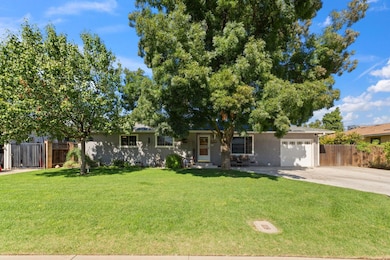
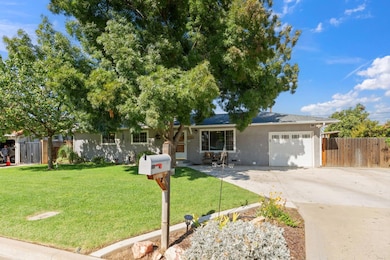
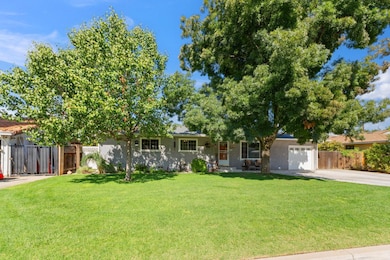
5739 E Hampton Way Fresno, CA 93727
Tarpey NeighborhoodEstimated payment $2,288/month
Highlights
- RV or Boat Parking
- Fruit Trees
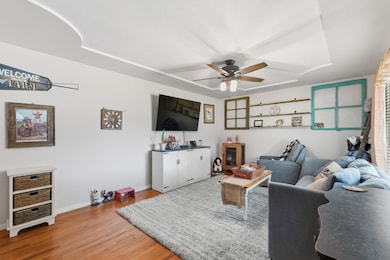
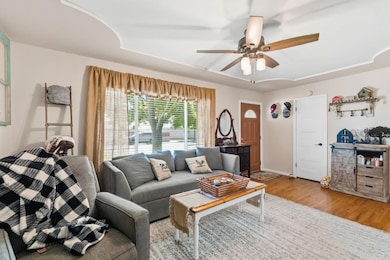
- Wood Flooring
- Reyburn Intermediate School Rated A
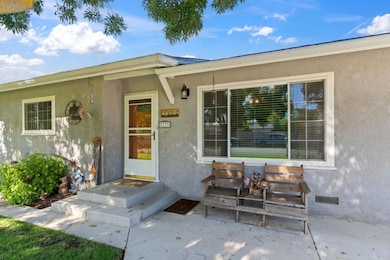
- Ranch Style House
- Mature Landscaping
About This Home
Welcome home to this charming and beautifully maintained 3-bedroom, 1.5-bath residence,located in a quiet and established Fresno neighborhood. This inviting home offers two spacious living rooms, including a permitted expansion that adds incredible versatility, perfect for entertaining, relaxing, or creating a family game or media room.
The thoughtfully updated kitchen features solid-surface countertops, ample cabinetry, and a seamless flow into both living areas, blending comfort with functionality. Step outside to your private backyard oasis, complete with mature landscaping, a lush green lawn, and fruit-bearing lemon, lime, and orange trees.
Enjoy outdoor living year-round under the covered patio with a custom pergola, ideal for BBQs, gatherings, or peaceful evenings at home. The property also offers RV parking, adding convenience and flexibility for your lifestyle needs.
Additional highlights include a newer roof (2020) and HVAC system installed in 2007, along with excellent curb appeal and true pride of ownership throughout. Conveniently located near schools, shopping, parks, and freeway access, this move-in-ready home is a rare find. Come see it and fall in love!
Listing Agent
Lorena Carranza-Ayala
3D Realty License #02161675 Listed on: 10/18/2025
Home Details
Home Type
- Single Family
Year Built
- Built in 1957
Lot Details
- 8,000 Sq Ft Lot
- Lot Dimensions are 80x100
- Mature Landscaping
- Front and Back Yard Sprinklers
- Fruit Trees
Parking
- RV or Boat Parking
Home Design
- Ranch Style House
- Wood Foundation
- Composition Roof
- Stucco
Interior Spaces
- 1,458 Sq Ft Home
- Double Pane Windows
- Family Room
- Formal Dining Room
- Wood Flooring
- Laundry in Garage
Kitchen
- Oven or Range
- Microwave
- Dishwasher
- Trash Compactor
- Disposal
Bedrooms and Bathrooms
- 3 Bedrooms
- 1.5 Bathrooms
- Bathtub with Shower
Additional Features
- Covered Patio or Porch
- Central Heating and Cooling System
Map
Home Values in the Area
Average Home Value in this Area
Tax History
| Year | Tax Paid | Tax Assessment Tax Assessment Total Assessment is a certain percentage of the fair market value that is determined by local assessors to be the total taxable value of land and additions on the property. | Land | Improvement |
|---|---|---|---|---|
| 2025 | $1,516 | $134,220 | $34,476 | $99,744 |
| 2023 | $1,485 | $129,010 | $33,138 | $95,872 |
| 2022 | $1,435 | $126,482 | $32,489 | $93,993 |
| 2021 | $1,393 | $124,002 | $31,852 | $92,150 |
| 2020 | $1,387 | $122,732 | $31,526 | $91,206 |
| 2019 | $1,359 | $120,326 | $30,908 | $89,418 |
| 2018 | $1,328 | $117,967 | $30,302 | $87,665 |
| 2017 | $1,304 | $115,655 | $29,708 | $85,947 |
| 2016 | $1,259 | $113,388 | $29,126 | $84,262 |
| 2015 | $1,238 | $111,686 | $28,689 | $82,997 |
| 2014 | $1,214 | $109,500 | $28,128 | $81,372 |
Property History
| Date | Event | Price | List to Sale | Price per Sq Ft |
|---|---|---|---|---|
| 02/17/2026 02/17/26 | Price Changed | $405,000 | -1.2% | $278 / Sq Ft |
| 01/07/2026 01/07/26 | Price Changed | $410,000 | -1.2% | $281 / Sq Ft |
| 10/18/2025 10/18/25 | For Sale | $415,000 | -- | $285 / Sq Ft |
Purchase History
| Date | Type | Sale Price | Title Company |
|---|---|---|---|
| Interfamily Deed Transfer | -- | Commerce Title Company | |
| Individual Deed | $76,500 | North American Title Co |
Mortgage History
| Date | Status | Loan Amount | Loan Type |
|---|---|---|---|
| Open | $160,000 | New Conventional | |
| Closed | $61,500 | No Value Available | |
| Closed | $15,000 | No Value Available | |
| Closed | $40,000 | No Value Available |
Source: Fresno MLS
MLS Number: 638577
APN: 495-075-19
Disclaimer: Certain information contained herein is derived from information provided by parties other than Homes.com. All information provided is deemed reliable, but is not guaranteed to be accurate and should be independently verified.
![]() IDX information is provided exclusively for personal, non-commercial use, and may not be used for any purpose other than to identify prospective properties consumers may be interested in purchasing. Information is deemed reliable but not guaranteed.
IDX information is provided exclusively for personal, non-commercial use, and may not be used for any purpose other than to identify prospective properties consumers may be interested in purchasing. Information is deemed reliable but not guaranteed.
- 5703 E Hampton Way
- 4065 N Eddy Ave
- 4069 N Sunnyside Ave
- 5675 E Ashlan Ave
- 4052 N Sabre Dr
- 5625 E Tarpey Dr
- 1385 Bernadine Dr
- 5833 E Pontiac Way
- 3605 Phillip Ave
- 5582 E Swift Ave
- 1345 Robinson Ave
- 2916 Miami Ave
- 3762 N Claremont Ave
- 3849 N Stanford Ave
- 3099 Ezie Ave
- 1722 Buckingham Ave
- 5000 E Dakota Ave
- 3556 N Duke Ave Unit 165
- 5850 E Ramona Ave
- 1721 Holland Ave
- 1101-1103 Gettysburg Ave
- 6002 E Sussex Way
- 1170 Santa Ana Ave
- 5929 E Dayton Ave
- 5188 E Ashlan Ave
- 6173 E Robinson Ave
- 92 W Gettysburg Ave
- 33 W Santa Ana Ave Unit A
- 1200 Scott Ave
- 71 W Santa Ana Ave Unit Santa Ana Apartment
- 6050 E Princeton Ave
- 395 W Holland Ave Unit 104
- 3140 Peach Ave
- 3080 Peach Ave
- 4083 N Peach Ave
- 215 W Santa Ana Ave
- 400 W Gettysburg Ave
- 289 W Santa Ana Ave
- 2220 Villa Ave
- 2120 Villa Ave
Ask me questions while you tour the home.