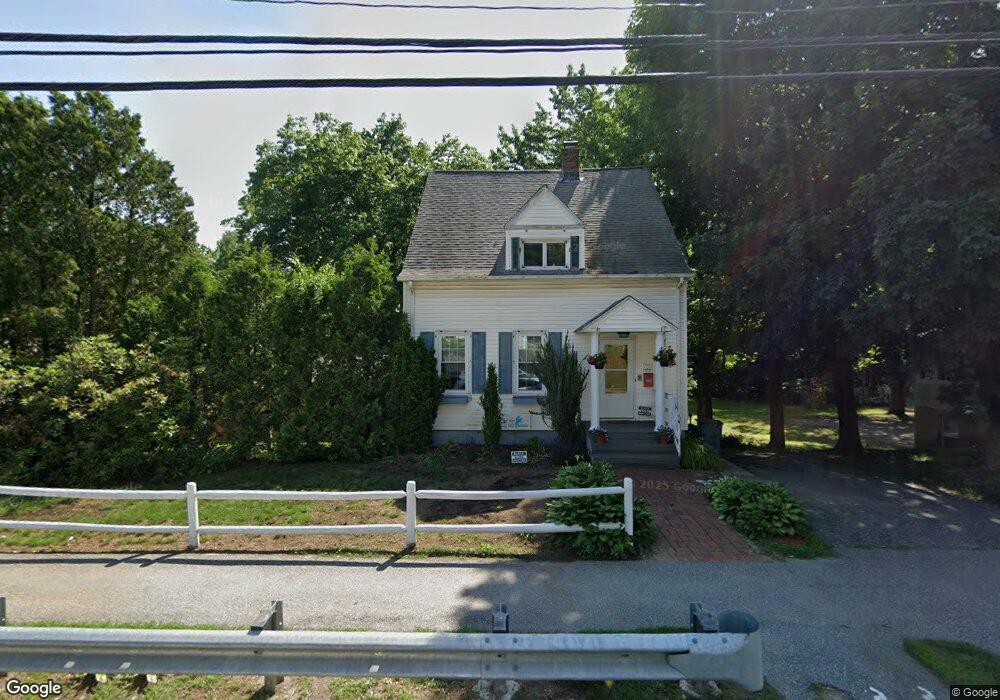
574 Chandler St Worcester, MA 01602
Tatnuck NeighborhoodEstimated Value: $502,000 - $527,000
3
Beds
2
Baths
1,789
Sq Ft
$289/Sq Ft
Est. Value
About This Home
This home is located at 574 Chandler St, Worcester, MA 01602 and is currently estimated at $517,371, approximately $289 per square foot. 574 Chandler St is a home located in Worcester County with nearby schools including Chandler Magnet, Jacob Hiatt Magnet School, and May Street Elementary School.
Ownership History
Date
Name
Owned For
Owner Type
Purchase Details
Closed on
Sep 29, 1992
Sold by
Groesbeck Paul and Hasegawa Kathleen
Bought by
Thomsen Tom H and Thomsen Karen
Current Estimated Value
Purchase Details
Closed on
Jun 21, 1990
Sold by
Butkewich Michael S
Bought by
Groesbeck Paul S
Create a Home Valuation Report for This Property
The Home Valuation Report is an in-depth analysis detailing your home's value as well as a comparison with similar homes in the area
Home Values in the Area
Average Home Value in this Area
Purchase History
| Date | Buyer | Sale Price | Title Company |
|---|---|---|---|
| Thomsen Tom H | $162,000 | -- | |
| Groesbeck Paul S | $175,000 | -- |
Source: Public Records
Mortgage History
| Date | Status | Borrower | Loan Amount |
|---|---|---|---|
| Open | Groesbeck Paul S | $224,088 | |
| Closed | Groesbeck Paul S | $205,700 | |
| Closed | Groesbeck Paul S | $207,000 |
Source: Public Records
Tax History Compared to Growth
Tax History
| Year | Tax Paid | Tax Assessment Tax Assessment Total Assessment is a certain percentage of the fair market value that is determined by local assessors to be the total taxable value of land and additions on the property. | Land | Improvement |
|---|---|---|---|---|
| 2025 | $6,309 | $478,300 | $150,300 | $328,000 |
| 2024 | $6,054 | $440,300 | $150,300 | $290,000 |
| 2023 | $5,813 | $405,400 | $130,900 | $274,500 |
| 2022 | $5,920 | $389,200 | $142,300 | $246,900 |
| 2021 | $5,711 | $350,800 | $113,900 | $236,900 |
| 2020 | $5,491 | $323,000 | $113,900 | $209,100 |
| 2019 | $5,126 | $284,800 | $103,100 | $181,700 |
| 2018 | $5,153 | $272,500 | $103,100 | $169,400 |
| 2017 | $4,970 | $258,600 | $103,100 | $155,500 |
| 2016 | $4,726 | $229,300 | $78,500 | $150,800 |
| 2015 | $4,602 | $229,300 | $78,500 | $150,800 |
| 2014 | $4,481 | $229,300 | $78,500 | $150,800 |
Source: Public Records
Map
Nearby Homes
- 563 Chandler St
- 47R Yarnie Unit 3B
- 47R Yarnie Unit 3A
- 47R Yarnie Unit 1B
- 47R Yarnie Unit 2B
- 47R Yarnie Unit 4B
- 47R Yarnie Unit 8B
- 47R Yarnie Unit 5A
- 47R Yarnie Unit 6B
- 47R Yarnie Unit 4A
- 47R Yarnie Unit 1A
- 47R Yarnie Unit 9
- 47R Yarnie Unit 8A
- 47R Yarnie Unit 6A
- 47R Yarnie Unit 7A
- 47R Yarnie Unit 5B
- 47R Yarnie Unit 2A
- 47R Yarnie Unit 7B
- 20 Manhattan Rd
- 806 Pleasant St
- 576 Chandler St
- 572 Chandler St
- 578 Chandler St
- 573 Chandler St
- 577 Chandler St
- 570 Chandler St
- 568 Chandler St
- 580 Chandler St
- 579 Chandler St
- 581 Chandler St
- 566 Chandler St
- 582 Chandler St
- 25 Rydal St
- 583 Chandler St
- 564 Chandler St
- 23 Rydal St
- 584 Chandler St
- 19 Rydal St
- 585 Chandler St
- 4 Hunthurst Cir