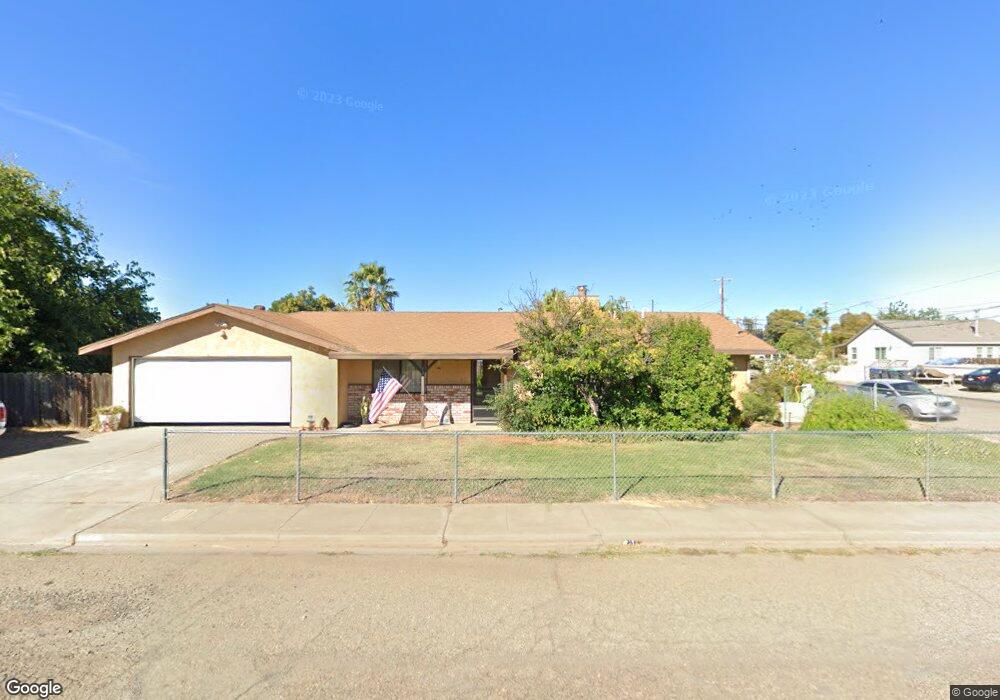
574 Hinkle St Red Bluff, CA 96080
Estimated Value: $123,000 - $339,000
3
Beds
2
Baths
1,548
Sq Ft
$177/Sq Ft
Est. Value
About This Home
This home is located at 574 Hinkle St, Red Bluff, CA 96080 and is currently estimated at $273,284, approximately $176 per square foot. 574 Hinkle St is a home located in Tehama County with nearby schools including William M. Metteer Elementary School, Vista Preparatory Academy, and Red Bluff High School.
Ownership History
Date
Name
Owned For
Owner Type
Purchase Details
Closed on
May 19, 2025
Sold by
Manry Floyd
Bought by
Floyd Neal Manry Living Trust and Manry
Current Estimated Value
Purchase Details
Closed on
Apr 23, 2009
Sold by
Kondaur Capital Corporation
Bought by
Manry Floyd
Purchase Details
Closed on
Feb 19, 2009
Sold by
Pryor Mike
Bought by
Kondaur Capital Corporation
Purchase Details
Closed on
Dec 6, 2006
Sold by
Pryor Tracy
Bought by
Pryor Mike
Home Financials for this Owner
Home Financials are based on the most recent Mortgage that was taken out on this home.
Original Mortgage
$39,750
Interest Rate
6.01%
Mortgage Type
Stand Alone Second
Purchase Details
Closed on
May 10, 2006
Sold by
Cox Harley T
Bought by
Pryor Mike and Pryor Tracy
Home Financials for this Owner
Home Financials are based on the most recent Mortgage that was taken out on this home.
Original Mortgage
$280,000
Interest Rate
6.3%
Mortgage Type
Purchase Money Mortgage
Purchase Details
Closed on
Oct 12, 2004
Sold by
Cox Harley T and Cox Kay F
Bought by
Cox Harley T and Cox Kay F
Create a Home Valuation Report for This Property
The Home Valuation Report is an in-depth analysis detailing your home's value as well as a comparison with similar homes in the area
Purchase History
| Date | Buyer | Sale Price | Title Company |
|---|---|---|---|
| Floyd Neal Manry Living Trust | -- | None Listed On Document | |
| Manry Floyd | $107,000 | First American Title Company | |
| Kondaur Capital Corporation | $72,000 | Accommodation | |
| Pryor Mike | -- | Placer Title Company | |
| Pryor Mike | $250,000 | Placer Title Company | |
| Cox Harley T | -- | -- |
Source: Public Records
Mortgage History
| Date | Status | Borrower | Loan Amount |
|---|---|---|---|
| Previous Owner | Pryor Mike | $39,750 | |
| Previous Owner | Pryor Mike | $198,750 | |
| Previous Owner | Pryor Mike | $280,000 |
Source: Public Records
Tax History
| Year | Tax Paid | Tax Assessment Tax Assessment Total Assessment is a certain percentage of the fair market value that is determined by local assessors to be the total taxable value of land and additions on the property. | Land | Improvement |
|---|---|---|---|---|
| 2025 | $1,331 | $137,780 | $45,066 | $92,714 |
| 2023 | $1,307 | $132,432 | $43,317 | $89,115 |
| 2022 | $1,297 | $129,836 | $42,468 | $87,368 |
| 2021 | $1,244 | $127,291 | $41,636 | $85,655 |
| 2020 | $1,269 | $125,987 | $41,210 | $84,777 |
| 2019 | $1,275 | $123,517 | $40,402 | $83,115 |
| 2018 | $1,113 | $114,764 | $37,540 | $77,224 |
| 2017 | $1,035 | $104,331 | $34,127 | $70,204 |
| 2016 | $936 | $99,363 | $32,502 | $66,861 |
| 2015 | $936 | $99,363 | $32,502 | $66,861 |
| 2014 | $810 | $86,403 | $28,263 | $58,140 |
Source: Public Records
Map
Nearby Homes
- 131 Brookridge Dr Unit 1
- 10.94 S Jackson St
- 810 Vista Way
- 1212 S Jackson St
- 425 S Jackson St
- 10.04 Vista Way
- 56.19 Vista Way
- 660 Villa Dr
- 406 S Jackson St
- 1210 Wetter Way
- 590 Brearcliffe Dr
- 845 Olive St
- 8 Sutter St
- 821 Locust St
- 4 Sutter St
- 224 S Jackson St
- 1160 Orange St
- 1235 Britt Ln
- 910 Aloha St
- 1560 Carl Ct
Your Personal Tour Guide
Ask me questions while you tour the home.