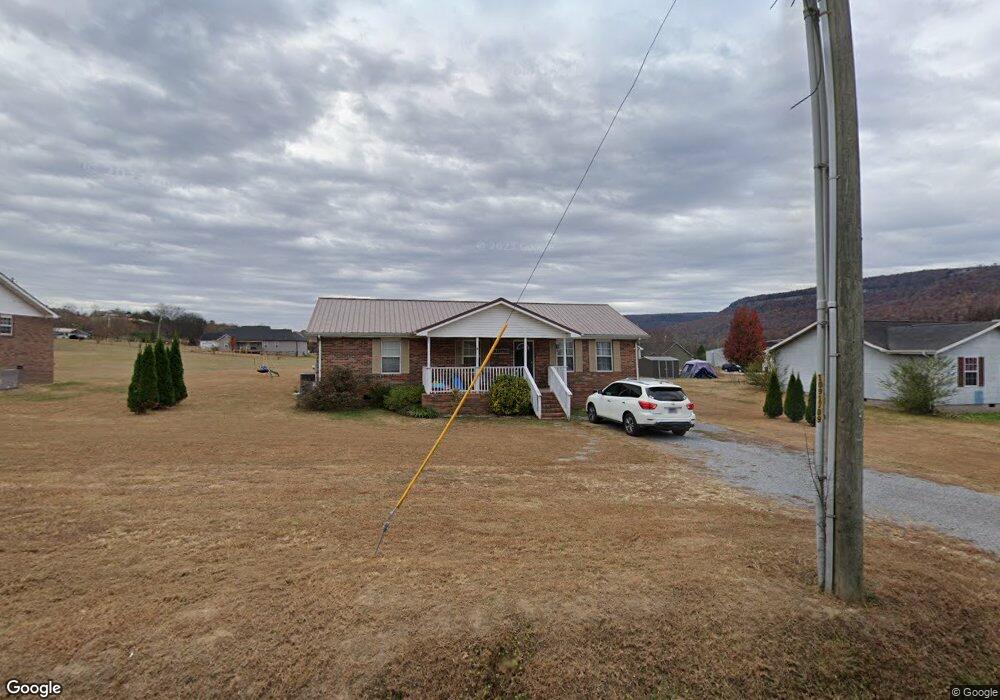
574 John Burch Rd Dunlap, TN 37327
Estimated Value: $240,711 - $292,000
3
Beds
2
Baths
1,323
Sq Ft
$202/Sq Ft
Est. Value
About This Home
This home is located at 574 John Burch Rd, Dunlap, TN 37327 and is currently estimated at $267,428, approximately $202 per square foot. 574 John Burch Rd is a home located in Sequatchie County with nearby schools including Griffith Elementary School, Sequatchie County Middle School, and Sequatchie County High School.
Ownership History
Date
Name
Owned For
Owner Type
Purchase Details
Closed on
Aug 13, 2019
Sold by
Cunningham Nicholas J and Cunningham Jennifer E
Bought by
Crabtree Cole A
Current Estimated Value
Home Financials for this Owner
Home Financials are based on the most recent Mortgage that was taken out on this home.
Original Mortgage
$139,393
Outstanding Balance
$121,628
Interest Rate
3.73%
Mortgage Type
New Conventional
Estimated Equity
$145,800
Purchase Details
Closed on
Aug 6, 2007
Sold by
Turner James W
Bought by
Cunningham Nicholas J
Purchase Details
Closed on
Aug 28, 2002
Bought by
Turner James W and Wife Natalie
Purchase Details
Closed on
Jul 28, 2000
Bought by
Swanger Creed
Purchase Details
Closed on
Aug 28, 1997
Bought by
Farley Donald and Wife Charlotte
Create a Home Valuation Report for This Property
The Home Valuation Report is an in-depth analysis detailing your home's value as well as a comparison with similar homes in the area
Home Values in the Area
Average Home Value in this Area
Purchase History
We collect this data history from publicly available records. To have your information removed, we recommend requesting removal directly through your county’s website.
| Date | Buyer | Sale Price | Title Company |
|---|---|---|---|
| Crabtree Cole A | $138,000 | None Available | |
| Cunningham Nicholas J | $78,000 | -- | |
| Turner James W | $73,500 | -- | |
| Swanger Creed | $67,000 | -- | |
| Farley Donald | $8,000 | -- |
Source: Public Records
Mortgage History
We collect this data history from publicly available records. To have your information removed, we recommend requesting removal directly through your county’s website.
| Date | Status | Borrower | Loan Amount |
|---|---|---|---|
| Open | Crabtree Cole A | $139,393 |
Source: Public Records
Tax History
| Year | Tax Paid | Tax Assessment Tax Assessment Total Assessment is a certain percentage of the fair market value that is determined by local assessors to be the total taxable value of land and additions on the property. | Land | Improvement |
|---|---|---|---|---|
| 2025 | $768 | $41,825 | $3,375 | $38,450 |
| 2024 | $768 | $41,825 | $3,375 | $38,450 |
| 2023 | $768 | $41,825 | $3,375 | $38,450 |
| 2022 | $625 | $25,575 | $3,125 | $22,450 |
| 2021 | $625 | $25,575 | $3,125 | $22,450 |
| 2020 | $687 | $28,125 | $3,125 | $25,000 |
| 2019 | $687 | $28,125 | $3,125 | $25,000 |
| 2018 | $687 | $28,125 | $3,125 | $25,000 |
| 2017 | $687 | $28,125 | $3,125 | $25,000 |
| 2016 | $685 | $26,675 | $3,125 | $23,550 |
| 2015 | $685 | $26,675 | $3,125 | $23,550 |
| 2014 | $633 | $24,625 | $3,125 | $21,500 |
Source: Public Records
Map
Nearby Homes
- 0 Treeline Dr Unit 1510685
- 0 Treeline Dr Unit 5
- 0 Treeline Dr Unit 1510684
- 0 Treeline Dr Unit 4
- 74 Hardin Rd
- 67 Shady Oaks Cove
- 331 Hardin Rd
- 0 Hardin Rd Unit 1523572
- 0 Hardin Rd Unit 1321169
- 919 John Burch Rd
- 150 Galloway Airport Rd
- 108 Galloway Airport Rd
- 0 John Burch Rd Unit RTC2705187
- 0 John Burch Rd Unit A 1395827
- 3 Countryside Dr
- 152 Highland Dr
- 109 Hidden Ridge Loop
- 00 Countryside Dr
- 0 Countryside Dr Unit RTC3035699
- 88 Clover Dale Rd S
- 574 John Burch Rd W
- 596 John Burch Rd W
- 552 John Burch Rd
- 596 John Burch Rd
- 102 Little Ponderosa Cove
- 618 John Burch Rd
- 463 John Burch Rd W
- 618 John Burch Rd
- 530 John Burch Rd
- 57 Applewood Ln
- 105 Little Ponderosa Cove
- 508 John Burch Rd
- 98 Little Ponderosa Cove
- 664 John Burch Rd
- 14 Little Ponderosa Cove
- 93 Little Ponderosa Cove
- 36 Little Ponderosa Cove
- 57 Hardin Rd
- 28 Little Ponderosa Cove
- 8 Little Ponderosa Cove
Your Personal Tour Guide
Ask me questions while you tour the home.