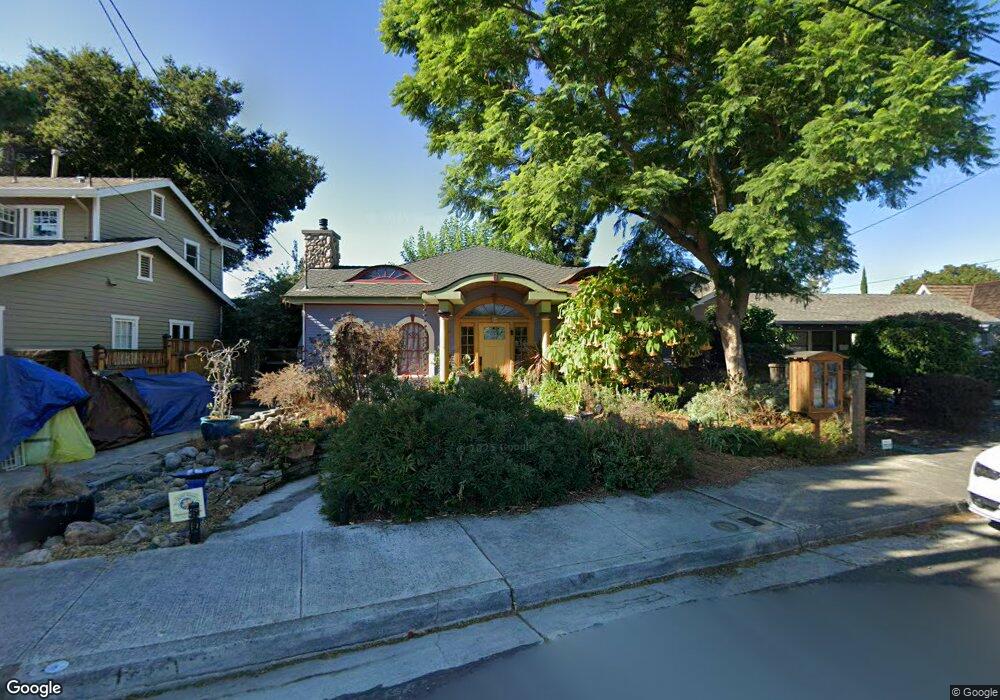
574 Park Ct Santa Clara, CA 95050
Downtown Santa Clara NeighborhoodEstimated Value: $1,344,000 - $1,474,062
3
Beds
1
Bath
1,296
Sq Ft
$1,096/Sq Ft
Est. Value
About This Home
This home is located at 574 Park Ct, Santa Clara, CA 95050 and is currently estimated at $1,420,266, approximately $1,095 per square foot. 574 Park Ct is a home located in Santa Clara County with nearby schools including Westwood Elementary School, Buchser Middle School, and Santa Clara High School.
Ownership History
Date
Name
Owned For
Owner Type
Purchase Details
Closed on
Jul 14, 2016
Sold by
Mclarney Brett Kyle and Miller Monica
Bought by
Mclarney Brett Kyle and Miller Monica
Current Estimated Value
Home Financials for this Owner
Home Financials are based on the most recent Mortgage that was taken out on this home.
Original Mortgage
$468,700
Interest Rate
3.6%
Mortgage Type
New Conventional
Purchase Details
Closed on
Sep 1, 2004
Sold by
Mclarney Brett and Miller Monica
Bought by
Mclarney Brett Kyle and Miller Monica
Purchase Details
Closed on
Dec 31, 2001
Sold by
Mclarney James Patrick
Bought by
Mclarney Brett and Miller Monica
Home Financials for this Owner
Home Financials are based on the most recent Mortgage that was taken out on this home.
Original Mortgage
$376,000
Interest Rate
6.51%
Create a Home Valuation Report for This Property
The Home Valuation Report is an in-depth analysis detailing your home's value as well as a comparison with similar homes in the area
Home Values in the Area
Average Home Value in this Area
Purchase History
| Date | Buyer | Sale Price | Title Company |
|---|---|---|---|
| Mclarney Brett Kyle | -- | Old Republic Title Company | |
| Mclarney Brett Kyle | -- | Old Republic Title Company | |
| Mclarney Brett Kyle | -- | -- | |
| Mclarney Brett | $376,000 | -- | |
| Mclarney James Patrick | $376,000 | -- |
Source: Public Records
Mortgage History
| Date | Status | Borrower | Loan Amount |
|---|---|---|---|
| Closed | Mclarney Brett Kyle | $468,700 | |
| Closed | Mclarney Brett | $376,000 |
Source: Public Records
Tax History Compared to Growth
Tax History
| Year | Tax Paid | Tax Assessment Tax Assessment Total Assessment is a certain percentage of the fair market value that is determined by local assessors to be the total taxable value of land and additions on the property. | Land | Improvement |
|---|---|---|---|---|
| 2025 | $760 | $61,159 | $29,309 | $31,850 |
| 2024 | $760 | $59,961 | $28,735 | $31,226 |
| 2023 | $751 | $58,786 | $28,172 | $30,614 |
| 2022 | $751 | $57,634 | $27,620 | $30,014 |
| 2021 | $744 | $56,505 | $27,079 | $29,426 |
| 2020 | $728 | $55,927 | $26,802 | $29,125 |
| 2019 | $728 | $54,831 | $26,277 | $28,554 |
| 2018 | $686 | $53,757 | $25,762 | $27,995 |
| 2017 | $680 | $52,704 | $25,257 | $27,447 |
| 2016 | $733 | $51,671 | $24,762 | $26,909 |
| 2015 | $728 | $50,896 | $24,391 | $26,505 |
| 2014 | $679 | $49,900 | $23,914 | $25,986 |
Source: Public Records
Map
Nearby Homes
- 783 Park Ct
- 2201 The Alameda Unit 22
- 1128 Morse St
- 1372 Davis St
- 1830 Heatherdale Ave
- 2760 Park Ave
- 1494 Mckendrie St
- 1945 Park Ave Unit 2
- 2012 Heatherdale Ave
- 2183 Cherrystone Dr
- 177 Monroe St Unit 8
- 907 Rancho Place
- 1567 Mcdaniel Ave
- 966 Silicon Dr
- 909 Myrtle St
- 645 Jackson St
- 1190 Emory St
- 2373 Newhall St
- 2026 Emory St
- 1940 Mcdaniel Ave