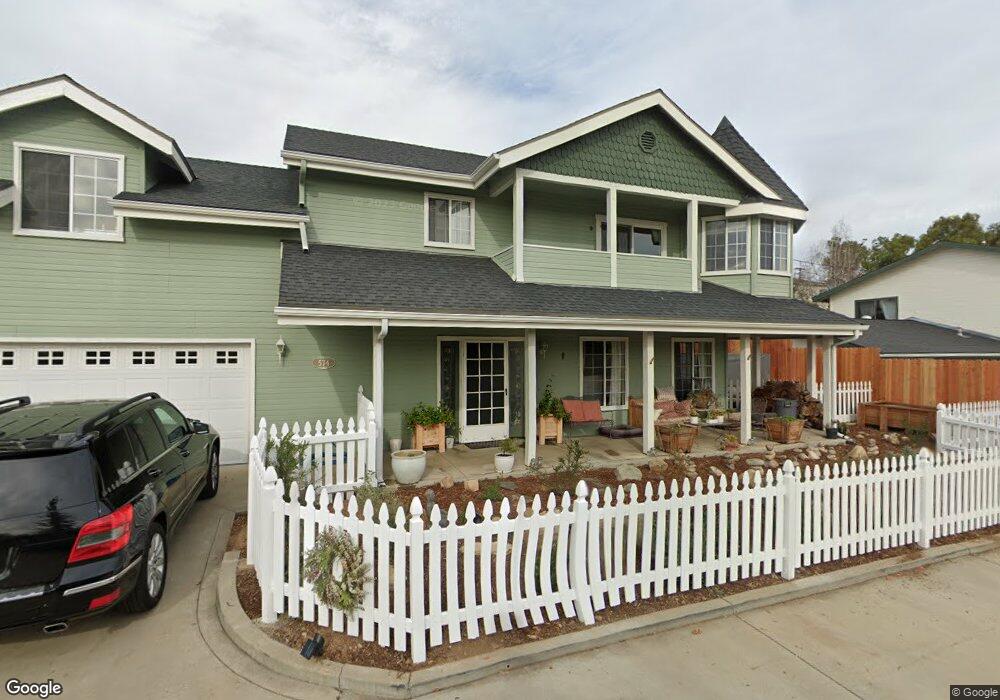
574 Pine St Unit Adelg Solvang, CA 93463
Estimated Value: $1,199,000 - $1,225,000
4
Beds
4
Baths
2,115
Sq Ft
$571/Sq Ft
Est. Value
About This Home
This home is located at 574 Pine St Unit Adelg, Solvang, CA 93463 and is currently estimated at $1,208,634, approximately $571 per square foot. 574 Pine St Unit Adelg is a home located in Santa Barbara County with nearby schools including Solvang Elementary School, Santa Ynez Valley Union High School, and Olive Grove Charter - Buellton.
Ownership History
Date
Name
Owned For
Owner Type
Purchase Details
Closed on
Aug 11, 2021
Sold by
Mueller Rachelle M
Bought by
Caplan Staci Elizabeth
Current Estimated Value
Home Financials for this Owner
Home Financials are based on the most recent Mortgage that was taken out on this home.
Original Mortgage
$636,000
Outstanding Balance
$577,450
Interest Rate
2.8%
Mortgage Type
New Conventional
Estimated Equity
$631,184
Purchase Details
Closed on
Jul 25, 2016
Sold by
Mcgillivary Alex and Mcgillivary Jessica
Bought by
Mueller Rachelle M
Home Financials for this Owner
Home Financials are based on the most recent Mortgage that was taken out on this home.
Original Mortgage
$320,000
Interest Rate
3.41%
Mortgage Type
New Conventional
Purchase Details
Closed on
Mar 2, 2011
Sold by
Hsbc Bank Usa National Association
Bought by
Mcgillivary Alex and Thorpe Jessica
Home Financials for this Owner
Home Financials are based on the most recent Mortgage that was taken out on this home.
Original Mortgage
$375,250
Interest Rate
4.83%
Mortgage Type
New Conventional
Purchase Details
Closed on
Nov 24, 2010
Sold by
Botello Jesus
Bought by
Hsbc Bank Usa National Association
Purchase Details
Closed on
Mar 27, 2006
Sold by
Whiting David J and Whiting Sharon L
Bought by
Botello Jesus
Home Financials for this Owner
Home Financials are based on the most recent Mortgage that was taken out on this home.
Original Mortgage
$138,000
Interest Rate
5.84%
Mortgage Type
Stand Alone Second
Purchase Details
Closed on
Jul 13, 2000
Sold by
Catherine Deleissegues
Bought by
Whiting David J and Whiting Sharon I
Home Financials for this Owner
Home Financials are based on the most recent Mortgage that was taken out on this home.
Original Mortgage
$294,400
Interest Rate
8.37%
Create a Home Valuation Report for This Property
The Home Valuation Report is an in-depth analysis detailing your home's value as well as a comparison with similar homes in the area
Home Values in the Area
Average Home Value in this Area
Purchase History
| Date | Buyer | Sale Price | Title Company |
|---|---|---|---|
| Caplan Staci Elizabeth | $795,000 | Chicago Title Company | |
| Mueller Rachelle M | $602,000 | Chicago Title Company | |
| Mcgillivary Alex | $395,000 | Lawyers Title | |
| Hsbc Bank Usa National Association | $425,000 | Accommodation | |
| Botello Jesus | $690,000 | Chicago Title Company | |
| Whiting David J | $368,000 | First American Title Co |
Source: Public Records
Mortgage History
| Date | Status | Borrower | Loan Amount |
|---|---|---|---|
| Open | Caplan Staci Elizabeth | $636,000 | |
| Previous Owner | Mueller Rachelle M | $320,000 | |
| Previous Owner | Mcgillivary Alex | $375,250 | |
| Previous Owner | Botello Jesus | $138,000 | |
| Previous Owner | Botello Jesus | $552,000 | |
| Previous Owner | Whiting David J | $294,400 | |
| Closed | Whiting David J | $36,800 |
Source: Public Records
Tax History
| Year | Tax Paid | Tax Assessment Tax Assessment Total Assessment is a certain percentage of the fair market value that is determined by local assessors to be the total taxable value of land and additions on the property. | Land | Improvement |
|---|---|---|---|---|
| 2025 | $8,889 | $843,660 | $397,953 | $445,707 |
| 2023 | $8,889 | $810,900 | $382,500 | $428,400 |
| 2022 | $8,672 | $795,000 | $375,000 | $420,000 |
| 2021 | $6,974 | $645,463 | $268,050 | $377,413 |
| 2020 | $6,870 | $638,846 | $265,302 | $373,544 |
| 2019 | $6,733 | $626,320 | $260,100 | $366,220 |
| 2018 | $6,619 | $614,040 | $255,000 | $359,040 |
| 2017 | $6,507 | $602,000 | $250,000 | $352,000 |
| 2016 | $4,625 | $427,491 | $211,040 | $216,451 |
| 2014 | $4,349 | $412,823 | $203,799 | $209,024 |
Source: Public Records
Map
Nearby Homes
- 566 Pine St
- 590 Pine St
- 1850 Old Mission Dr
- 533 Pine St
- 0 Old Mill Rd
- 1662 Eucalyptus Dr
- 639 Roskilde Rd
- 665 Hillside Dr
- 1999 Viborg Rd
- 1995 Viborg Rd
- 2089 Village Ln
- 2123 Village Ln
- 312 Freya Dr
- 312 Freya Dr Unit SL
- 926 Nysted Dr
- 821 Fredensborg Canyon Rd
- 922 College Canyon Rd
- 226 Valhalla Dr
- 2124 Creekside Dr
- 224 Valhalla Dr
Your Personal Tour Guide
Ask me questions while you tour the home.