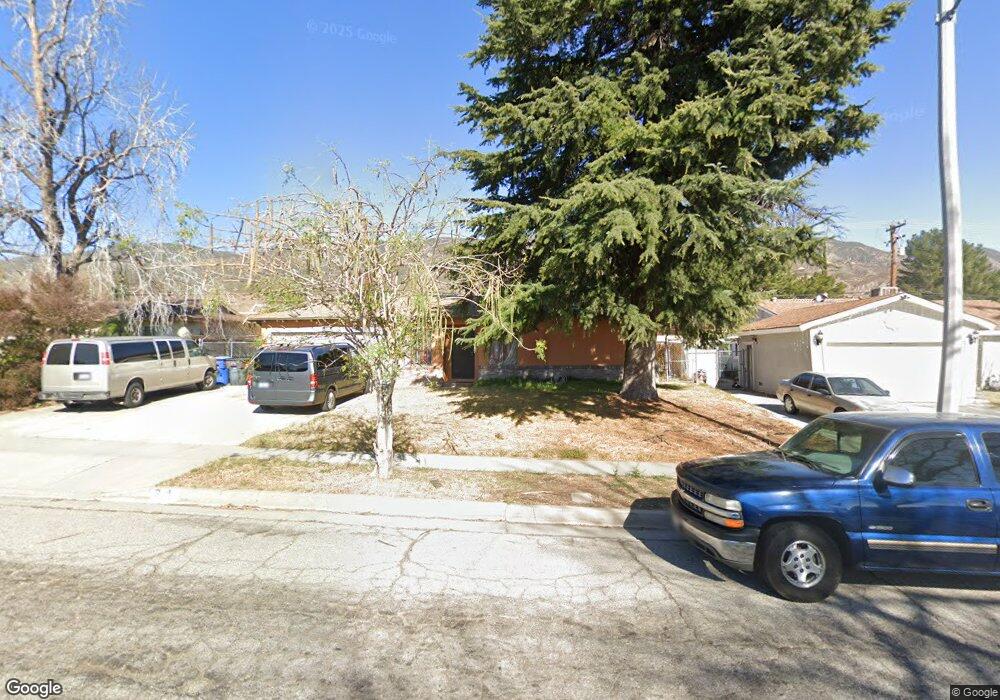
574 Sequoia St San Bernardino, CA 92407
Cajon NeighborhoodEstimated Value: $511,657 - $587,000
3
Beds
3
Baths
1,952
Sq Ft
$285/Sq Ft
Est. Value
About This Home
This home is located at 574 Sequoia St, San Bernardino, CA 92407 and is currently estimated at $556,664, approximately $285 per square foot. 574 Sequoia St is a home located in San Bernardino County with nearby schools including Hillside Elementary School, Shandin Hills Middle School, and Cajon High School.
Create a Home Valuation Report for This Property
The Home Valuation Report is an in-depth analysis detailing your home's value as well as a comparison with similar homes in the area
Home Values in the Area
Average Home Value in this Area
Tax History Compared to Growth
Tax History
| Year | Tax Paid | Tax Assessment Tax Assessment Total Assessment is a certain percentage of the fair market value that is determined by local assessors to be the total taxable value of land and additions on the property. | Land | Improvement |
|---|---|---|---|---|
| 2025 | $2,282 | $172,624 | $32,653 | $139,971 |
| 2024 | $2,282 | $169,239 | $32,013 | $137,226 |
| 2023 | $2,225 | $165,920 | $31,385 | $134,535 |
| 2022 | $2,227 | $162,667 | $30,770 | $131,897 |
| 2021 | $2,229 | $159,478 | $30,167 | $129,311 |
| 2020 | $2,232 | $157,843 | $29,858 | $127,985 |
| 2019 | $2,168 | $154,748 | $29,273 | $125,475 |
| 2018 | $2,144 | $151,714 | $28,699 | $123,015 |
| 2017 | $2,079 | $148,739 | $28,136 | $120,603 |
| 2016 | $2,016 | $145,822 | $27,584 | $118,238 |
| 2015 | $1,903 | $143,632 | $27,170 | $116,462 |
| 2014 | $1,850 | $140,819 | $26,638 | $114,181 |
Source: Public Records
Map
Nearby Homes
- 564 Northpark Blvd
- 604 Northpark Blvd
- 4966 N Stoddard Ave
- 4956 N Stoddard Ave
- 5095 N G St
- 661 W 55th St
- 4835 Acacia Ave
- 5537 N Stoddard Ave
- 0 W Hill Dr Unit IG25219633
- 641 W 48th St
- 5430 Electric Ave
- 523 W Acacia Ct
- 5734 N E St
- 4667 N Stoddard Ave
- 5835 Louise St
- 5550 N I St
- 5304 Sierra Rd
- 131 W 49th St
- 4417 N Mayfield Ave
- 4558 N Mountain View Ave
- 564 Sequoia St
- 584 Sequoia St
- 575 Northpark Blvd
- 565 Northpark Blvd
- 554 Sequoia St
- 594 Sequoia St
- 585 Northpark Blvd
- 555 Northpark Blvd
- 5195 N F St
- 5194 Acacia Ave
- 545 Northpark Blvd
- 544 Sequoia St
- 595 Northpark Blvd
- 5177 N F St
- 5172 Acacia Ave
- 535 Northpark Blvd
- 5159 N F St
- 534 Sequoia St
- 5150 Acacia Ave
- 605 Sequoia St