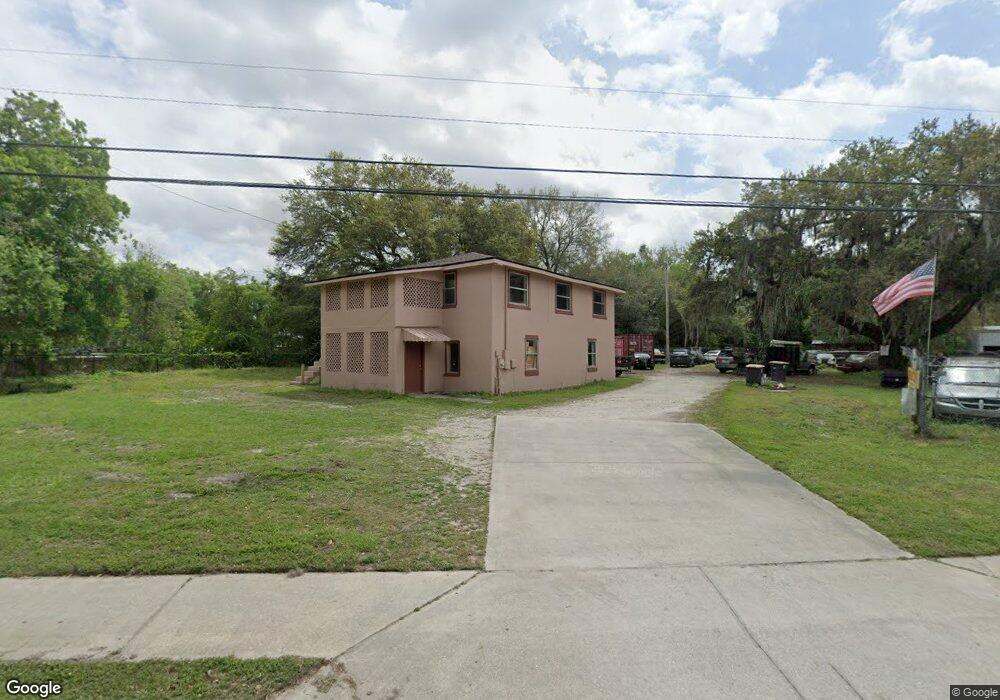
5740 Lenox Ave Jacksonville, FL 32205
Hillcrest NeighborhoodEstimated Value: $270,392 - $311,000
4
Beds
2
Baths
2,304
Sq Ft
$126/Sq Ft
Est. Value
About This Home
This home is located at 5740 Lenox Ave, Jacksonville, FL 32205 and is currently estimated at $290,348, approximately $126 per square foot. 5740 Lenox Ave is a home located in Duval County with nearby schools including Andros Karperos, Hyde Park Elementary School, and Lake Shore Middle School.
Ownership History
Date
Name
Owned For
Owner Type
Purchase Details
Closed on
Jan 2, 2012
Sold by
Kennedy Cathy J and Jackson Connie E
Bought by
Pugh Johnny C and Pugh Rebecca M
Current Estimated Value
Purchase Details
Closed on
Mar 8, 2011
Sold by
Isom Wade D and Menefee Al
Bought by
Kennedy Cathy J
Purchase Details
Closed on
Feb 23, 2011
Sold by
Isom Wade D and Menefee Al
Bought by
Kennedy Cathy J
Purchase Details
Closed on
Feb 1, 2005
Sold by
Vining Roy J and Vining Betty J
Bought by
Isom Wade D
Home Financials for this Owner
Home Financials are based on the most recent Mortgage that was taken out on this home.
Original Mortgage
$375,000
Interest Rate
8.5%
Mortgage Type
Seller Take Back
Purchase Details
Closed on
Sep 4, 2002
Sold by
Abbott Jamie D
Bought by
Vining Roy J and Vining Bettie J
Create a Home Valuation Report for This Property
The Home Valuation Report is an in-depth analysis detailing your home's value as well as a comparison with similar homes in the area
Home Values in the Area
Average Home Value in this Area
Purchase History
| Date | Buyer | Sale Price | Title Company |
|---|---|---|---|
| Pugh Johnny C | $225,000 | Attorney | |
| Kennedy Cathy J | -- | Attorney | |
| Kennedy Cathy J | -- | None Available | |
| Kennedy Cathy J | -- | Attorney | |
| Isom Wade D | $425,000 | Barker Land Title & Escrow I | |
| Vining Roy J | $70,000 | -- |
Source: Public Records
Mortgage History
| Date | Status | Borrower | Loan Amount |
|---|---|---|---|
| Previous Owner | Isom Wade D | $375,000 | |
| Closed | Isom Wade D | $35,000 |
Source: Public Records
Tax History Compared to Growth
Tax History
| Year | Tax Paid | Tax Assessment Tax Assessment Total Assessment is a certain percentage of the fair market value that is determined by local assessors to be the total taxable value of land and additions on the property. | Land | Improvement |
|---|---|---|---|---|
| 2025 | $3,306 | $164,059 | $94,851 | $69,208 |
| 2024 | $3,263 | $164,780 | $94,851 | $69,929 |
| 2023 | $3,263 | $161,521 | $87,555 | $73,966 |
| 2022 | $2,953 | $152,136 | $87,555 | $64,581 |
| 2021 | $2,904 | $145,254 | $87,555 | $57,699 |
| 2020 | $2,888 | $143,460 | $87,555 | $55,905 |
| 2019 | $2,877 | $140,755 | $87,555 | $53,200 |
| 2018 | $2,792 | $134,810 | $85,050 | $49,760 |
| 2017 | $2,755 | $131,248 | $85,050 | $46,198 |
| 2016 | $2,714 | $126,697 | $0 | $0 |
| 2015 | $2,709 | $124,201 | $0 | $0 |
| 2014 | $2,749 | $124,963 | $0 | $0 |
Source: Public Records
Map
Nearby Homes
- 6145 Delmar Place
- 6151 Delmar Place
- 6121 Key Hollow Ct
- 1130 Fountain Rd
- 1302 Cedar Annex Ave
- 5549 Plymouth St
- 1207 Neva St
- 1205 Neva St
- 1169 Orton St
- 1238 Pangola Dr
- 1339 Ellis Rd S
- 1231 Pangola Dr
- 1168 Pangola Dr
- 1249 Pangola Dr
- 1422 Ellis Trace Dr W
- 1242 Mull St
- 1246 Mull St
- 1449 Delmar St
- 5419 Woodcrest Rd
- Sandalwood Plan at Park Trace - Seasons
- 5758 Lenox Ave
- 5711 Lenox Ave
- 5705 Lenox Ave
- 5710 Lenox Ave
- 5699 Lenox Ave
- 1243 Delmar St
- 0 Delmar St Unit 966718
- 0 Delmar St Unit 669637
- 0 Delmar St Unit 624465
- 0 Delmar St Unit 581600
- 0 Delmar St Unit 982717
- 0 Delmar St Unit 1201856
- 0 Delmar St Unit 1151612
- 0 Delmar St Unit 214895
- 0 Delmar St
- 1249 Delmar St
- 5850 Lenox Ave
- 1248 Delmar St
- 1256 Delmar St
- 1260 Delmar St