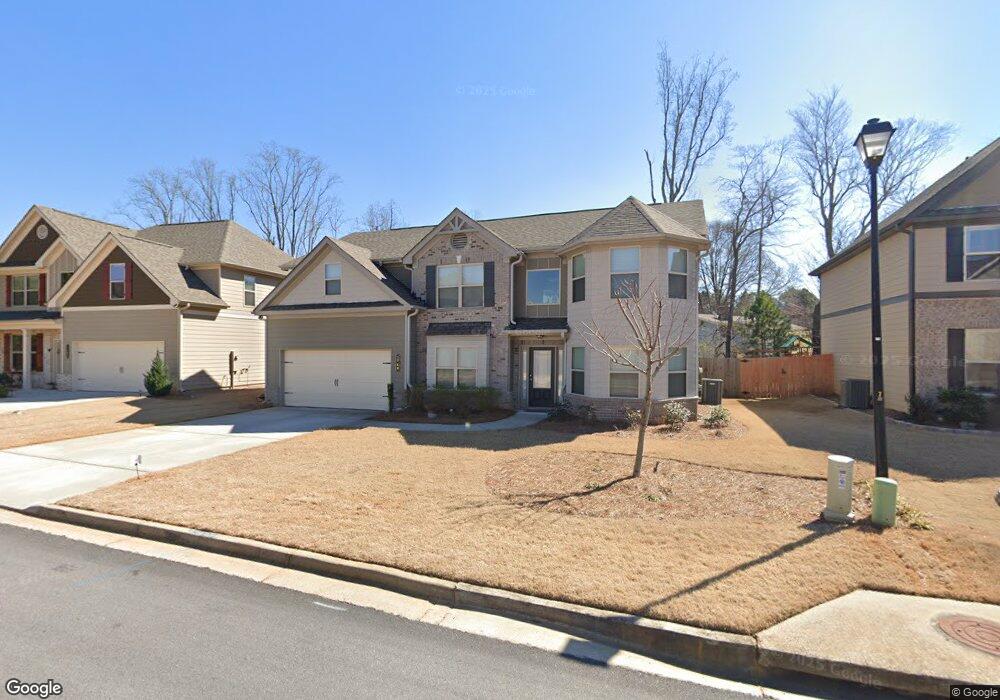
5740 Shore Isle Unit 19a Flowery Br, GA 30542
Estimated Value: $449,835 - $538,000
5
Beds
3
Baths
2,801
Sq Ft
$175/Sq Ft
Est. Value
About This Home
This home is located at 5740 Shore Isle Unit 19a, Flowery Br, GA 30542 and is currently estimated at $489,959, approximately $174 per square foot. 5740 Shore Isle Unit 19a is a home located in Hall County with nearby schools including Flowery Branch Elementary School, West Hall Middle School, and West Hall High School.
Ownership History
Date
Name
Owned For
Owner Type
Purchase Details
Closed on
Jul 26, 2021
Sold by
Fraker Michael
Bought by
Peng Cheng and Kheav Chann Y
Current Estimated Value
Purchase Details
Closed on
May 18, 2018
Sold by
Almont Homes Ne Inc
Bought by
Fraker Michael
Home Financials for this Owner
Home Financials are based on the most recent Mortgage that was taken out on this home.
Original Mortgage
$210,140
Interest Rate
4.4%
Mortgage Type
New Conventional
Purchase Details
Closed on
Jan 6, 2017
Sold by
Not Provided
Bought by
Almont Homes Ne Inc
Purchase Details
Closed on
Sep 29, 2008
Sold by
United Community Bank
Bought by
Land Investment Partners Llc 12
Purchase Details
Closed on
Sep 2, 2008
Sold by
Park Walk At Lanier Llc
Bought by
United Community Bank
Create a Home Valuation Report for This Property
The Home Valuation Report is an in-depth analysis detailing your home's value as well as a comparison with similar homes in the area
Home Values in the Area
Average Home Value in this Area
Purchase History
| Date | Buyer | Sale Price | Title Company |
|---|---|---|---|
| Peng Cheng | $398,000 | -- | |
| Fraker Michael | $285,200 | -- | |
| Almont Homes Ne Inc | $2,622,000 | -- | |
| Land Investment Partners Llc 12 | $2,124,000 | -- | |
| United Community Bank | $4,200,000 | -- |
Source: Public Records
Mortgage History
| Date | Status | Borrower | Loan Amount |
|---|---|---|---|
| Previous Owner | Fraker Michael | $210,140 |
Source: Public Records
Tax History Compared to Growth
Tax History
| Year | Tax Paid | Tax Assessment Tax Assessment Total Assessment is a certain percentage of the fair market value that is determined by local assessors to be the total taxable value of land and additions on the property. | Land | Improvement |
|---|---|---|---|---|
| 2024 | $4,843 | $172,480 | $22,000 | $150,480 |
| 2023 | $3,975 | $176,920 | $22,000 | $154,920 |
| 2022 | $3,484 | $135,160 | $22,000 | $113,160 |
| 2021 | $2,869 | $109,680 | $16,000 | $93,680 |
| 2020 | $3,139 | $116,480 | $18,000 | $98,480 |
| 2019 | $2,968 | $109,280 | $12,000 | $97,280 |
| 2018 | $286 | $10,000 | $10,000 | $0 |
| 2017 | $53 | $1,800 | $1,800 | $0 |
| 2016 | $51 | $1,800 | $1,800 | $0 |
| 2015 | $98 | $1,800 | $1,800 | $0 |
| 2014 | $98 | $3,400 | $3,400 | $0 |
Source: Public Records
Map
Nearby Homes
- 5729 Jim Crow Rd
- 5867 Meadow View Ln
- 5837 Meadow View Ln
- 6024 Park Bay Ct
- 5644 Mohave Ct
- 5573 Ashmoore Ct
- 5581 Ashmoore Ct
- 6544 Teal Trail Dr
- 5531 Radford Rd
- 6619 Blue Cove Dr
- 5381 Gray Birch Bend
- 5505 Broadleaf Trail
- 5525 Leyland Dr
- 5529 Leyland Dr
- 6025 River Oaks Dr
- 5522 Leyland Dr
- 5526 Leyland Dr
- 5407 Maple Grove Ln
- 5993 Overby Rd
- 5740 Shore Isle
- 5740 Shore Isle Ct Unit 19
- 5740 Shore Isle Ct
- 5744 Shore Isle
- 5736 Shore Isle Ct
- 5744 Shore Isle Ct
- 5732 Shore Isle Ct Unit 17
- 5732 Shore Isle Ct
- 5704 Jim Crow Rd
- 5751 Shore Isle Ct Unit 4
- 5751 Shore Isle Ct
- 5729 Shore Isle Ct
- 5729 Shore Isle Ct Unit 5
- 5751 Shore Isle
- 5728 Shore Isle Ct
- 5728 Shore Isle Ct Unit 16
- 5715 Shore Isle Ct
- 5755 Shore Isle
- 5175 Shore Isle Ct
- 5708 Shore Isle Unit 11