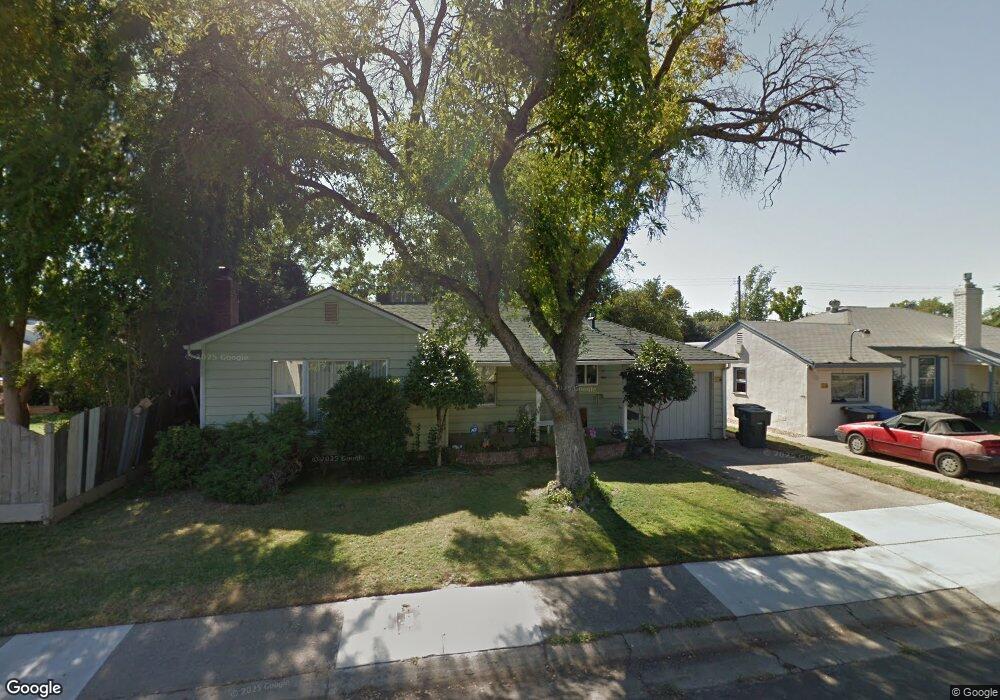
5740 Velma Way Sacramento, CA 95824
Fruitridge Manor NeighborhoodEstimated Value: $253,000 - $352,000
2
Beds
1
Bath
855
Sq Ft
$364/Sq Ft
Est. Value
About This Home
This home is located at 5740 Velma Way, Sacramento, CA 95824 and is currently estimated at $310,943, approximately $363 per square foot. 5740 Velma Way is a home located in Sacramento County with nearby schools including Suy:u Elementary School, Will C. Wood Middle School, and Hiram W. Johnson High School.
Ownership History
Date
Name
Owned For
Owner Type
Purchase Details
Closed on
May 17, 2012
Sold by
Nelson Patricia M and Nelson Survivor Trust
Bought by
Steffenhagen Gail
Current Estimated Value
Home Financials for this Owner
Home Financials are based on the most recent Mortgage that was taken out on this home.
Original Mortgage
$73,098
Outstanding Balance
$50,527
Interest Rate
3.85%
Mortgage Type
FHA
Estimated Equity
$260,416
Purchase Details
Closed on
Oct 20, 2008
Sold by
Nelson Patricia M
Bought by
Nelson Patricia M and The Nelson Survivors Trust
Purchase Details
Closed on
Oct 7, 2008
Sold by
Glyer Robert J
Bought by
Glyer Robert J and The Glyer Trust
Purchase Details
Closed on
May 28, 2008
Sold by
Jennings Elizabeth C and Elizabeth C Jennings 1999 Trus
Bought by
Nelson Patricia M and Glyer Robert J
Create a Home Valuation Report for This Property
The Home Valuation Report is an in-depth analysis detailing your home's value as well as a comparison with similar homes in the area
Home Values in the Area
Average Home Value in this Area
Purchase History
| Date | Buyer | Sale Price | Title Company |
|---|---|---|---|
| Steffenhagen Gail | $75,000 | North American Title Company | |
| Nelson Patricia M | -- | None Available | |
| Glyer Robert J | -- | None Available | |
| Nelson Patricia M | -- | None Available |
Source: Public Records
Mortgage History
| Date | Status | Borrower | Loan Amount |
|---|---|---|---|
| Open | Steffenhagen Gail | $73,098 |
Source: Public Records
Tax History Compared to Growth
Tax History
| Year | Tax Paid | Tax Assessment Tax Assessment Total Assessment is a certain percentage of the fair market value that is determined by local assessors to be the total taxable value of land and additions on the property. | Land | Improvement |
|---|---|---|---|---|
| 2025 | $1,258 | $94,190 | $25,114 | $69,076 |
| 2024 | $1,258 | $92,344 | $24,622 | $67,722 |
| 2023 | $1,228 | $90,535 | $24,140 | $66,395 |
| 2022 | $1,206 | $88,761 | $23,667 | $65,094 |
| 2021 | $1,152 | $87,021 | $23,203 | $63,818 |
| 2020 | $1,157 | $86,130 | $22,966 | $63,164 |
| 2019 | $1,134 | $84,442 | $22,516 | $61,926 |
| 2018 | $1,104 | $82,787 | $22,075 | $60,712 |
| 2017 | $1,088 | $81,165 | $21,643 | $59,522 |
| 2016 | $1,064 | $79,574 | $21,219 | $58,355 |
| 2015 | $1,047 | $78,380 | $20,901 | $57,479 |
| 2014 | $1,022 | $76,846 | $20,492 | $56,354 |
Source: Public Records
Map
Nearby Homes
- 7928 35th Ave
- 5841 35th Ave
- 5639 59th St
- 5532 Fruitridge Rd
- 5640 Fruitridge Rd
- 5501 59th St
- 5352 Young St
- 5341 Young St
- 5219 Thurman Way
- 5218 Thurman Way
- 5823 61st St
- 5413 61st St
- 6060 Mcmahon Dr
- 5749 Nina Way
- 5210 61st St
- 5940 Lemon Park Way
- 5946 Lemon Park Way
- 5101 Esmeralda St
- 6314 37th Ave
- 5561 48th St