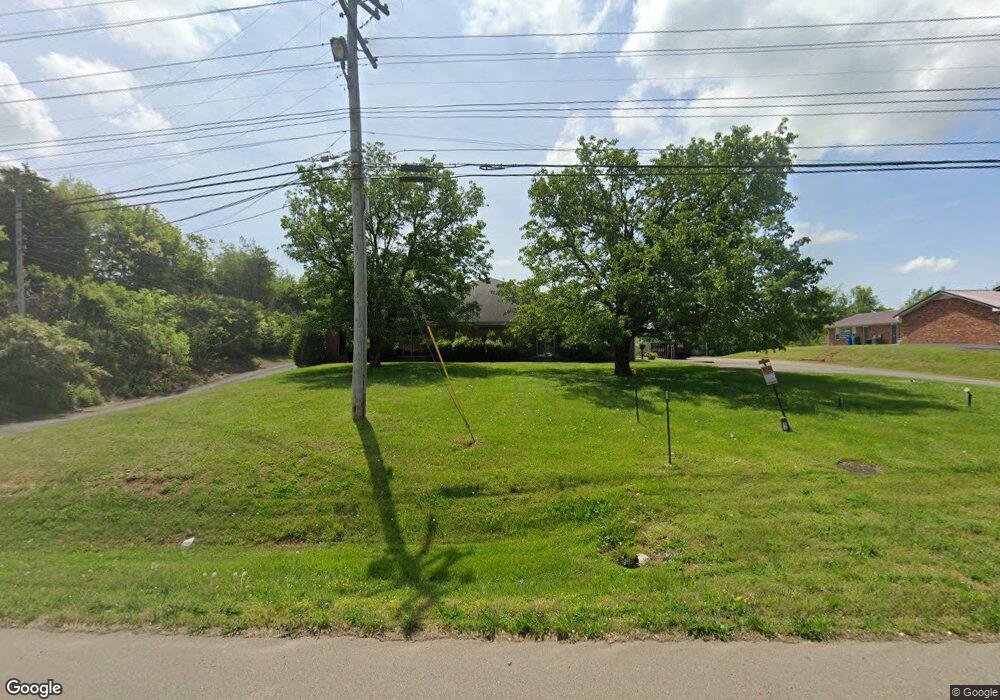
5741 W Andrew Johnson Hwy Morristown, TN 37814
--
Bed
2
Baths
6,384
Sq Ft
1.44
Acres
About This Home
This home is located at 5741 W Andrew Johnson Hwy, Morristown, TN 37814. 5741 W Andrew Johnson Hwy is a home located in Hamblen County with nearby schools including Alpha Elementary School, West View Middle School, and Morristown West High School.
Ownership History
Date
Name
Owned For
Owner Type
Purchase Details
Closed on
Mar 26, 2021
Sold by
Healthstar Properties 2
Bought by
Davenport John
Home Financials for this Owner
Home Financials are based on the most recent Mortgage that was taken out on this home.
Original Mortgage
$800,000
Outstanding Balance
$719,960
Interest Rate
2.8%
Mortgage Type
Commercial
Purchase Details
Closed on
Jun 7, 1996
Sold by
James Kenneth R and James Jo Anne
Bought by
Healthstar Properties
Purchase Details
Closed on
Feb 25, 1991
Bought by
James Kenneth R and Jo Anne
Purchase Details
Closed on
Feb 24, 1991
Bought by
James Kenneth and Jo Anne
Purchase Details
Closed on
Feb 23, 1991
Bought by
James Kenneth and Jo Anne
Purchase Details
Closed on
Feb 22, 1991
Bought by
James Kenneth and Jo Anne
Purchase Details
Closed on
Oct 5, 1988
Bought by
J & D Enterprises
Purchase Details
Closed on
Oct 4, 1988
Bought by
J & D Enterprises
Purchase Details
Closed on
Sep 28, 1988
Bought by
Bell Hubert J
Purchase Details
Closed on
Jul 31, 1976
Bought by
Bell Hubert J
Create a Home Valuation Report for This Property
The Home Valuation Report is an in-depth analysis detailing your home's value as well as a comparison with similar homes in the area
Home Values in the Area
Average Home Value in this Area
Purchase History
| Date | Buyer | Sale Price | Title Company |
|---|---|---|---|
| Davenport John | $690,000 | Foundation T&E Series Llc | |
| Davenport John | $690,000 | New Title Company Name | |
| Healthstar Properties | $460,000 | -- | |
| James Kenneth R | $103,300 | -- | |
| James Kenneth | -- | -- | |
| James Kenneth | $103,300 | -- | |
| James Kenneth | -- | -- | |
| J & D Enterprises | -- | -- | |
| J & D Enterprises | -- | -- | |
| Bell Hubert J | -- | -- | |
| Bell Hubert J | -- | -- |
Source: Public Records
Mortgage History
| Date | Status | Borrower | Loan Amount |
|---|---|---|---|
| Open | Davenport John | $800,000 | |
| Closed | Davenport John | $800,000 |
Source: Public Records
Tax History Compared to Growth
Tax History
| Year | Tax Paid | Tax Assessment Tax Assessment Total Assessment is a certain percentage of the fair market value that is determined by local assessors to be the total taxable value of land and additions on the property. | Land | Improvement |
|---|---|---|---|---|
| 2024 | $4,761 | $270,520 | $53,360 | $217,160 |
| 2023 | $4,761 | $270,520 | $0 | $0 |
| 2022 | $8,548 | $270,520 | $53,360 | $217,160 |
| 2021 | $8,548 | $270,520 | $53,360 | $217,160 |
| 2020 | $8,537 | $270,520 | $53,360 | $217,160 |
| 2019 | $8,797 | $258,760 | $53,360 | $205,400 |
| 2018 | $8,151 | $258,760 | $53,360 | $205,400 |
| 2017 | $8,021 | $258,760 | $53,360 | $205,400 |
| 2016 | $7,659 | $258,760 | $53,360 | $205,400 |
| 2015 | $7,126 | $258,760 | $53,360 | $205,400 |
| 2014 | -- | $258,760 | $53,360 | $205,400 |
| 2013 | -- | $280,160 | $0 | $0 |
Source: Public Records
Map
Nearby Homes
- 00 Fox Dr
- 234 Saint Johns Rd
- 430 Fox Dr
- 426 Willow Tree Ln
- 5087 Runnerstone Rd
- 5073 Runnerstone Rd
- 5715 Academy Dr
- 738 Bear Springs Rd
- 5043 Runnerstone Rd
- 5031 Runnerstone Rd
- 5203 Cub Cir
- 6163 Silver Fox Trail
- 5130 Old Highway 11e
- 6005 Shady Grove Rd
- 6262 Wintergreen Rd
- 412 Furrow Dr
- 420 Furrow Dr
- 413 Furrow Dr
- 428 Furrow Dr
- 5715 W Andrew Johnson Hwy
- 5740 W Andrew Johnson Hwy
- 5762 W Andrew Johnson Hwy
- 143 Brady Dr
- 5800 W Andrew Johnson Hwy
- 185 Brady Dr
- 5655 W Andrew Johnson Hwy
- 225 Brady Dr
- 5786 W Andrew Johnson Hwy
- 101 Fox Dr
- 227 Brady Dr
- 247 Brady Dr
- 5763 Woods Dr
- 226 Brady Dr
- 5712 Woods Dr
- 109 Fox Dr
- 279 Brady Dr
- 5633 W Andrew Johnson Hwy
- 248 Brady Dr
- 5688 Woods Dr