5742 Three Oaks Dr Unit 5 Raleigh, NC 27612
North Hills NeighborhoodEstimated Value: $246,000 - $280,000
--
Bed
3
Baths
1,400
Sq Ft
$187/Sq Ft
Est. Value
About This Home
This home is located at 5742 Three Oaks Dr Unit 5, Raleigh, NC 27612 and is currently estimated at $261,716, approximately $186 per square foot. 5742 Three Oaks Dr Unit 5 is a home located in Wake County with nearby schools including Lynn Road Elementary School, Carroll Middle, and Sanderson High School.
Ownership History
Date
Name
Owned For
Owner Type
Purchase Details
Closed on
Feb 7, 2011
Sold by
Beach Steve and Crean Tara M
Bought by
Crean Mercedes
Current Estimated Value
Purchase Details
Closed on
Jun 12, 2006
Sold by
Whitaker Daryl
Bought by
Beach Steve and Beach Tara
Home Financials for this Owner
Home Financials are based on the most recent Mortgage that was taken out on this home.
Original Mortgage
$94,500
Outstanding Balance
$70,047
Interest Rate
11.9%
Mortgage Type
Unknown
Estimated Equity
$191,669
Purchase Details
Closed on
Mar 15, 2006
Sold by
Moragne Kendall and Moragne Dionne
Bought by
Whitaker Daryl
Home Financials for this Owner
Home Financials are based on the most recent Mortgage that was taken out on this home.
Original Mortgage
$87,570
Interest Rate
11.85%
Mortgage Type
Fannie Mae Freddie Mac
Purchase Details
Closed on
Jun 24, 2005
Sold by
Mcneil Michael
Bought by
Moragne Kendall
Create a Home Valuation Report for This Property
The Home Valuation Report is an in-depth analysis detailing your home's value as well as a comparison with similar homes in the area
Home Values in the Area
Average Home Value in this Area
Purchase History
| Date | Buyer | Sale Price | Title Company |
|---|---|---|---|
| Crean Mercedes | -- | None Available | |
| Beach Steve | $105,000 | None Available | |
| Whitaker Daryl | $98,000 | None Available | |
| Moragne Kendall | $64,000 | -- |
Source: Public Records
Mortgage History
| Date | Status | Borrower | Loan Amount |
|---|---|---|---|
| Open | Beach Steve | $94,500 | |
| Previous Owner | Whitaker Daryl | $87,570 |
Source: Public Records
Tax History Compared to Growth
Tax History
| Year | Tax Paid | Tax Assessment Tax Assessment Total Assessment is a certain percentage of the fair market value that is determined by local assessors to be the total taxable value of land and additions on the property. | Land | Improvement |
|---|---|---|---|---|
| 2025 | $2,337 | $265,677 | $55,000 | $210,677 |
| 2024 | $2,327 | $265,677 | $55,000 | $210,677 |
| 2023 | $1,719 | $155,915 | $40,000 | $115,915 |
| 2022 | $1,599 | $155,915 | $40,000 | $115,915 |
| 2021 | $1,537 | $155,915 | $40,000 | $115,915 |
| 2020 | $1,509 | $155,915 | $40,000 | $115,915 |
| 2019 | $1,252 | $106,345 | $25,000 | $81,345 |
| 2018 | $1,182 | $106,345 | $25,000 | $81,345 |
| 2017 | $1,126 | $106,345 | $25,000 | $81,345 |
| 2016 | $1,103 | $106,345 | $25,000 | $81,345 |
| 2015 | $1,069 | $101,269 | $23,000 | $78,269 |
| 2014 | $1,014 | $101,269 | $23,000 | $78,269 |
Source: Public Records
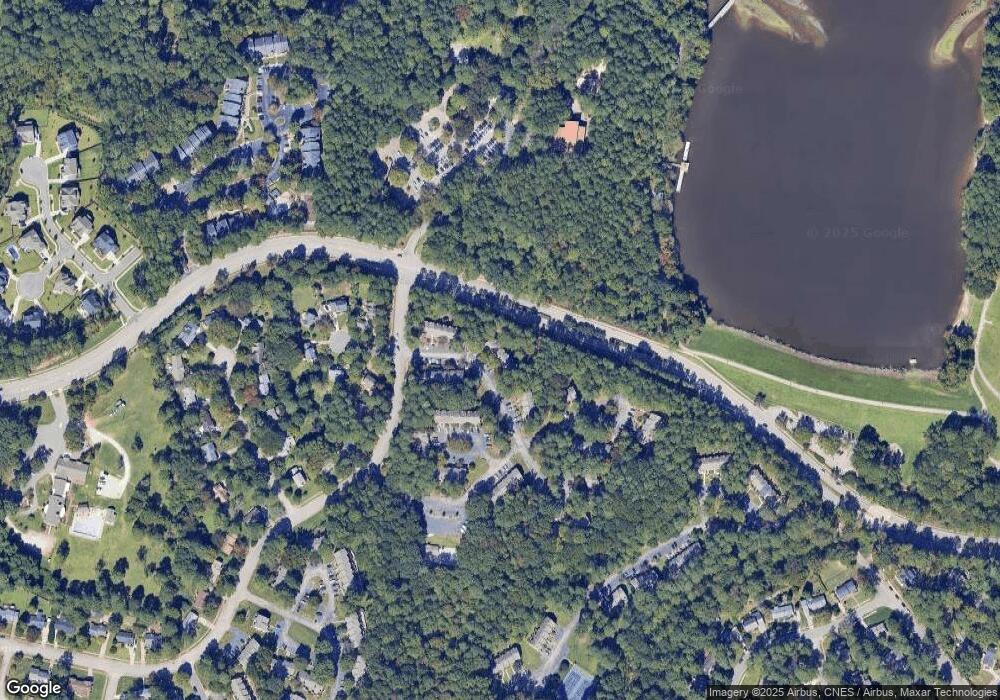
Map
Nearby Homes
- 5613 Oldtowne Rd
- 5444 Pine Top Cir
- 5418 Ridgeloch Place
- 1541 Shadowood Ln
- 6221 Rushingbrook Dr
- 5309 Ridgeloch Place
- 1500 Prisma Ct
- 1901 Longwood Dr
- 5613 Ashton Dr
- 1500 Shadowood Ln
- 5716 N Hills Dr
- 1337 Springlawn Ct
- 1375 Garden Crest Cir
- 1325 Springlawn Ct
- 5500 N Hills Dr
- 2205 Yorkgate Dr
- 813 Mill Greens Ct
- 1306 Lennox Place
- 6409 Lakeland Dr
- 1302 Springlawn Ct
- 5740 Three Oaks Dr
- 5744 Three Oaks Dr
- 5738 Three Oaks Dr
- 5736 Three Oaks Dr
- 5746 Three Oaks Dr
- 5734 Three Oaks Dr
- 5748 Three Oaks Dr
- 5745 Three Oaks Dr
- 5750 Three Oaks Dr
- 5747 Three Oaks Dr
- 5752 Three Oaks Dr
- 5730 Three Oaks Dr
- 5749 Three Oaks Dr
- 5760 Three Oaks Dr
- 5754 Three Oaks Dr
- 5751 Three Oaks Dr
- 5728 Three Oaks Dr
- 5756 Three Oaks Dr
- 5726 Three Oaks Dr
- 5753 Three Oaks Dr