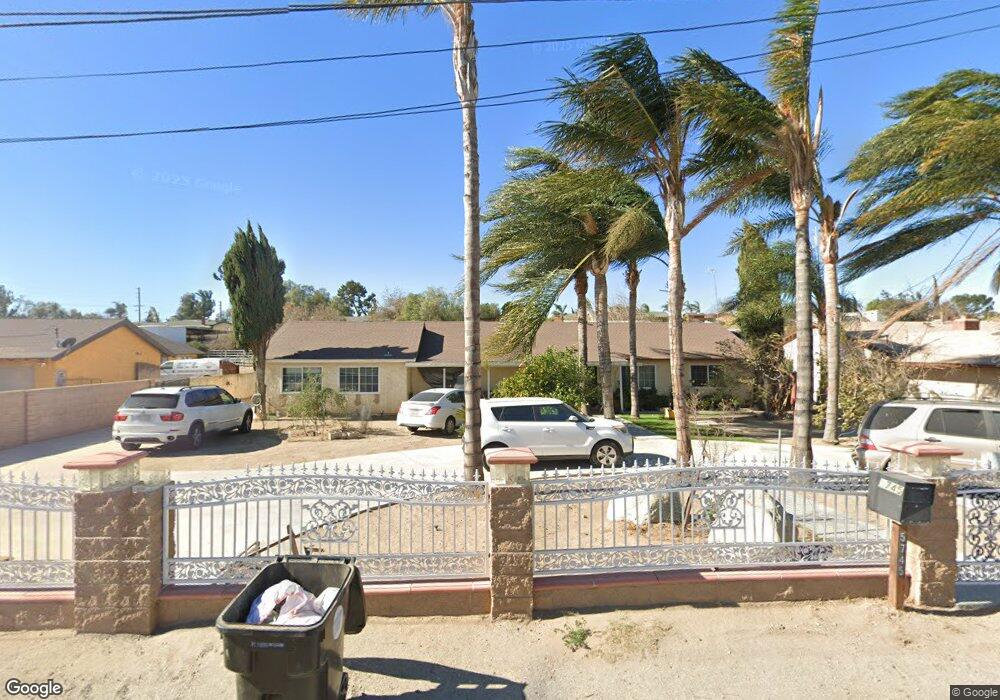
5745 Marlatt St Mira Loma, CA 91752
Estimated Value: $805,000 - $915,197
3
Beds
1
Bath
2,088
Sq Ft
$407/Sq Ft
Est. Value
About This Home
This home is located at 5745 Marlatt St, Mira Loma, CA 91752 and is currently estimated at $848,799, approximately $406 per square foot. 5745 Marlatt St is a home located in Riverside County with nearby schools including Troth Street Elementary School, Mira Loma Middle School, and Jurupa Valley High School.
Ownership History
Date
Name
Owned For
Owner Type
Purchase Details
Closed on
Dec 7, 2005
Sold by
Tapia Arnulfo
Bought by
Tapia Mario and Tapia Reyna
Current Estimated Value
Home Financials for this Owner
Home Financials are based on the most recent Mortgage that was taken out on this home.
Original Mortgage
$392,000
Outstanding Balance
$223,216
Interest Rate
6.59%
Mortgage Type
Purchase Money Mortgage
Estimated Equity
$625,583
Purchase Details
Closed on
Jun 15, 2004
Sold by
Deloera Abel and Deloera Enedina
Bought by
Tapia Arnulfo
Home Financials for this Owner
Home Financials are based on the most recent Mortgage that was taken out on this home.
Original Mortgage
$329,650
Interest Rate
5%
Mortgage Type
Purchase Money Mortgage
Purchase Details
Closed on
Apr 14, 2000
Sold by
Stephens Walter E and Stephens Bessie L
Bought by
Deloera Abel and Deloera Enedina
Home Financials for this Owner
Home Financials are based on the most recent Mortgage that was taken out on this home.
Original Mortgage
$152,000
Interest Rate
8.22%
Create a Home Valuation Report for This Property
The Home Valuation Report is an in-depth analysis detailing your home's value as well as a comparison with similar homes in the area
Home Values in the Area
Average Home Value in this Area
Purchase History
| Date | Buyer | Sale Price | Title Company |
|---|---|---|---|
| Tapia Mario | -- | Ticor Title Co | |
| Tapia Arnulfo | $347,000 | Advantage Title Inc | |
| Tapia Arnulfo | -- | Advantage Title Inc | |
| Deloera Abel | $160,000 | Stewart Title Company |
Source: Public Records
Mortgage History
| Date | Status | Borrower | Loan Amount |
|---|---|---|---|
| Open | Tapia Mario | $392,000 | |
| Previous Owner | Tapia Arnulfo | $329,650 | |
| Previous Owner | Deloera Abel | $152,000 |
Source: Public Records
Tax History Compared to Growth
Tax History
| Year | Tax Paid | Tax Assessment Tax Assessment Total Assessment is a certain percentage of the fair market value that is determined by local assessors to be the total taxable value of land and additions on the property. | Land | Improvement |
|---|---|---|---|---|
| 2025 | $6,808 | $603,778 | $136,642 | $467,136 |
| 2023 | $6,808 | $616,335 | $131,337 | $484,998 |
| 2022 | $6,313 | $568,957 | $128,762 | $440,195 |
| 2021 | $6,270 | $557,802 | $126,238 | $431,564 |
| 2020 | $5,801 | $515,247 | $116,761 | $398,486 |
| 2019 | $5,632 | $500,240 | $113,360 | $386,880 |
| 2018 | $5,345 | $481,000 | $109,000 | $372,000 |
| 2017 | $5,072 | $452,000 | $102,000 | $350,000 |
| 2016 | $4,957 | $439,000 | $99,000 | $340,000 |
| 2015 | $4,526 | $400,000 | $91,000 | $309,000 |
| 2014 | $4,267 | $397,000 | $90,000 | $307,000 |
Source: Public Records
Map
Nearby Homes
- 10538 54th St
- 6093 Troth St
- 5685 Ptolemy Way
- 11187 58th St
- 5344 Lucretia Ave
- 9950 60th St
- 10517 50th St
- 10457 50th St
- 11101 Gemini Ct
- 6415 Etiwanda Ave
- 9745 55th St
- 5286 Trail Canyon Dr
- 4900 Eclipse Ave
- 0 60th St Unit IV22125232
- 9798 Crossbay Loop Unit 2301
- 9798 Crossbay Loop Unit 2307
- 9798 Crossbay Loop Unit 2305
- 9798 Crossbay Loop Unit 2303
- 9792 Crossbay Loop Unit 2202
- 9792 Crossbay Loop Unit 2206
- 5725 Marlatt St
- 5769 Marlatt St
- 5785 Marlatt St
- 5715 Marlatt St
- 5730 Rachel Ln
- 5760 Rachel Ln
- 5766 Marlatt St
- 10529 58th St
- 5789 Marlatt St
- 5701 Marlatt St
- 5716 Marlatt St
- 5780 Rachel Ln
- 5700 Rachel Ln
- 5778 Marlatt St
- 5726 Marlatt St
- 5700 Marlatt St
- 5765 Rachel Ln
- 5735 Rachel Ln
- 5790 Marlatt St
- 5807 Marlatt St