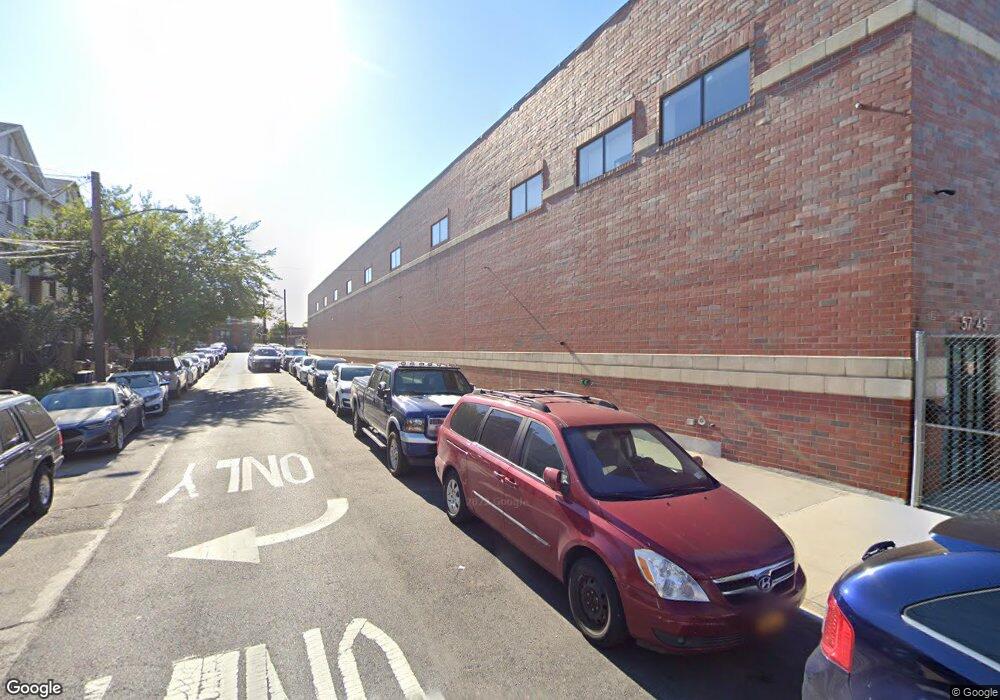
5745 Rust St Flushing, NY 11378
Maspeth NeighborhoodEstimated Value: $9,798,062
Studio
--
Bath
30,055
Sq Ft
$326/Sq Ft
Est. Value
About This Home
This home is located at 5745 Rust St, Flushing, NY 11378 and is currently estimated at $9,798,062, approximately $326 per square foot. 5745 Rust St is a home located in Queens County with nearby schools including I.S. 093 Ridgewood, Grover Cleveland High School, and The Renaissance Charter School 2.
Ownership History
Date
Name
Owned For
Owner Type
Purchase Details
Closed on
Oct 8, 2021
Sold by
Best Team Group Llc
Bought by
D & Y Group Llc
Current Estimated Value
Home Financials for this Owner
Home Financials are based on the most recent Mortgage that was taken out on this home.
Original Mortgage
$2,000,000
Outstanding Balance
$1,815,880
Interest Rate
2.8%
Mortgage Type
Purchase Money Mortgage
Estimated Equity
$7,982,182
Purchase Details
Closed on
Feb 11, 2019
Sold by
Best Team Group Llc New York Llc
Bought by
Best Team Group Llc Delaware Llc
Home Financials for this Owner
Home Financials are based on the most recent Mortgage that was taken out on this home.
Original Mortgage
$3,188,819
Interest Rate
4.5%
Mortgage Type
Purchase Money Mortgage
Purchase Details
Closed on
Dec 21, 2017
Sold by
Maspeth Development Llc
Bought by
Best Team Group Llc
Home Financials for this Owner
Home Financials are based on the most recent Mortgage that was taken out on this home.
Original Mortgage
$4,800,000
Interest Rate
3.95%
Mortgage Type
Purchase Money Mortgage
Purchase Details
Closed on
Mar 11, 2016
Sold by
Maspeth Development Llc
Bought by
E L Daw Inc
Purchase Details
Closed on
Oct 28, 2005
Sold by
San Sung Korean Methodist Church Of New
Bought by
Maspeth Development Llc
Create a Home Valuation Report for This Property
The Home Valuation Report is an in-depth analysis detailing your home's value as well as a comparison with similar homes in the area
Home Values in the Area
Average Home Value in this Area
Purchase History
| Date | Buyer | Sale Price | Title Company |
|---|---|---|---|
| D & Y Group Llc | -- | -- | |
| D & Y Group Llc | -- | -- | |
| Best Team Group Llc Delaware Llc | -- | -- | |
| Best Team Group Llc Delaware Llc | -- | -- | |
| Best Team Group Llc | $8,121,000 | -- | |
| Best Team Group Llc | $8,121,000 | -- | |
| Best Team Group Llc | $8,121,000 | -- | |
| E L Daw Inc | $1,268,906 | -- | |
| E L Daw Inc | $1,268,906 | -- | |
| E L Daw Inc | $1,268,906 | -- | |
| Maspeth Development Llc | $6,000,000 | -- | |
| Maspeth Development Llc | $6,000,000 | -- |
Source: Public Records
Mortgage History
| Date | Status | Borrower | Loan Amount |
|---|---|---|---|
| Open | D & Y Group Llc | $2,000,000 | |
| Closed | D & Y Group Llc | $2,000,000 | |
| Previous Owner | Best Team Group Llc Delaware Llc | $3,188,819 | |
| Previous Owner | Best Team Group Llc | $4,800,000 |
Source: Public Records
Tax History
| Year | Tax Paid | Tax Assessment Tax Assessment Total Assessment is a certain percentage of the fair market value that is determined by local assessors to be the total taxable value of land and additions on the property. | Land | Improvement |
|---|---|---|---|---|
| 2025 | $182,744 | $1,773,990 | $783,450 | $990,540 |
| 2024 | $182,744 | $1,725,300 | $783,450 | $941,850 |
| 2023 | $178,454 | $1,684,800 | $783,450 | $901,350 |
| 2022 | $178,296 | $1,781,550 | $783,450 | $998,100 |
| 2021 | $158,565 | $1,482,750 | $783,450 | $699,300 |
| 2020 | $176,000 | $1,683,000 | $783,450 | $899,550 |
| 2019 | $175,047 | $1,670,850 | $783,450 | $887,400 |
| 2018 | $171,558 | $1,631,712 | $767,262 | $864,450 |
| 2017 | $39,570 | $757,029 | $757,029 | $0 |
| 2016 | $102,820 | $757,029 | $757,029 | $0 |
| 2015 | $50,732 | $958,209 | $958,209 | $0 |
| 2014 | $50,732 | $927,108 | $927,108 | $0 |
Source: Public Records
Map
Nearby Homes
Your Personal Tour Guide
Ask me questions while you tour the home.