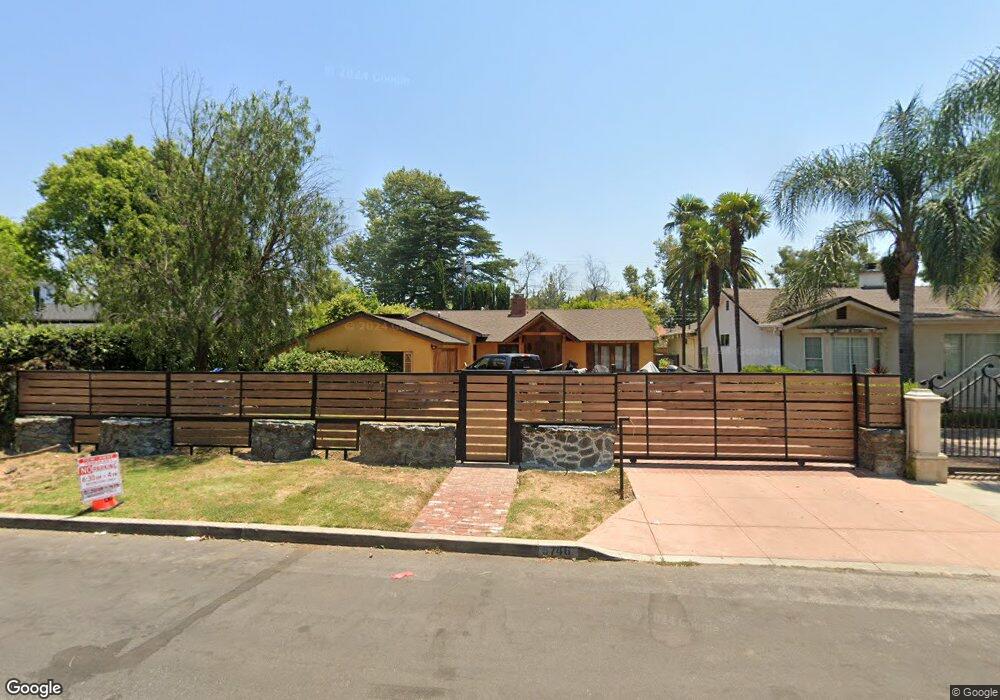
5746 Cantaloupe Ave van Nuys, CA 91401
Estimated Value: $1,136,000 - $1,421,000
2
Beds
2
Baths
1,782
Sq Ft
$689/Sq Ft
Est. Value
About This Home
This home is located at 5746 Cantaloupe Ave, van Nuys, CA 91401 and is currently estimated at $1,227,460, approximately $688 per square foot. 5746 Cantaloupe Ave is a home located in Los Angeles County with nearby schools including Erwin Street Elementary School, Ulysses S. Grant Senior High School, and Louis D. Armstrong Middle School.
Ownership History
Date
Name
Owned For
Owner Type
Purchase Details
Closed on
Jul 25, 2013
Sold by
Subero Carlos
Bought by
Subero Carlos and Subero Sharon
Current Estimated Value
Purchase Details
Closed on
Jan 14, 2013
Sold by
Rojany Janis
Bought by
Rojany Aviezer
Home Financials for this Owner
Home Financials are based on the most recent Mortgage that was taken out on this home.
Original Mortgage
$385,000
Outstanding Balance
$266,562
Interest Rate
3.28%
Mortgage Type
New Conventional
Estimated Equity
$960,898
Purchase Details
Closed on
Jun 12, 1999
Sold by
Braunstein Gene H
Bought by
Subero Carlos
Home Financials for this Owner
Home Financials are based on the most recent Mortgage that was taken out on this home.
Original Mortgage
$198,000
Interest Rate
8.37%
Create a Home Valuation Report for This Property
The Home Valuation Report is an in-depth analysis detailing your home's value as well as a comparison with similar homes in the area
Home Values in the Area
Average Home Value in this Area
Purchase History
| Date | Buyer | Sale Price | Title Company |
|---|---|---|---|
| Subero Carlos | -- | None Available | |
| Rojany Aviezer | -- | Fidelity National Title Co | |
| Subero Carlos | -- | Fidelity National Title Co | |
| Subero Carlos | $220,000 | American Title Co |
Source: Public Records
Mortgage History
| Date | Status | Borrower | Loan Amount |
|---|---|---|---|
| Open | Subero Carlos | $385,000 | |
| Closed | Subero Carlos | $198,000 |
Source: Public Records
Tax History Compared to Growth
Tax History
| Year | Tax Paid | Tax Assessment Tax Assessment Total Assessment is a certain percentage of the fair market value that is determined by local assessors to be the total taxable value of land and additions on the property. | Land | Improvement |
|---|---|---|---|---|
| 2025 | $5,468 | $436,477 | $328,900 | $107,577 |
| 2024 | $5,468 | $427,919 | $322,451 | $105,468 |
| 2023 | $5,366 | $419,529 | $316,129 | $103,400 |
| 2022 | $5,122 | $411,304 | $309,931 | $101,373 |
| 2021 | $5,054 | $403,240 | $303,854 | $99,386 |
| 2019 | $4,906 | $391,282 | $294,843 | $96,439 |
| 2018 | $4,793 | $383,611 | $289,062 | $94,549 |
| 2016 | $4,569 | $368,718 | $277,839 | $90,879 |
| 2015 | $4,504 | $363,180 | $273,666 | $89,514 |
| 2014 | $4,526 | $356,067 | $268,306 | $87,761 |
Source: Public Records
Map
Nearby Homes
- 5817 Cantaloupe Ave
- 5732 Mammoth Ave
- 5711 Colbath Ave
- 5758 Costello Ave
- 5635 Woodman Ave Unit H
- 5846 Woodman Ave
- 5801 Costello Ave
- 5831 Buffalo Ave
- 5616 Buffalo Ave
- 5512 Ranchito Ave
- 13801 Oxnard St Unit 206
- 13801 Oxnard St Unit 202
- 5934 Murietta Ave
- 5634 Hazeltine Ave
- 5919 - 5921 Cantaloupe Ave
- 5934 Murrieta
- 5514 Woodman Ave
- 5653 Hazeltine Ave
- 5655 Hazeltine Ave
- 5446 Matilija Ave
- 5750 Cantaloupe Ave
- 5738 Cantaloupe Ave
- 5756 Cantaloupe Ave
- 5732 Cantaloupe Ave
- 5747 Matilija Ave
- 5751 Matilija Ave
- 5741 Matilija Ave
- 5757 Matilija Ave
- 5733 Matilija Ave
- 5726 Cantaloupe Ave
- 5745 Cantaloupe Ave
- 5739 Cantaloupe Ave
- 5755 Cantaloupe Ave
- 5727 Matilija Ave
- 5735 Cantaloupe Ave
- 5802 Cantaloupe Ave
- 5722 Cantaloupe Ave
- 5729 Cantaloupe Ave
- 5723 Matilija Ave
- 5803 Matilija Ave