5746 S Marshfield Ave Chicago, IL 60636
Englewood NeighborhoodEstimated Value: $74,000 - $137,000
2
Beds
1
Bath
745
Sq Ft
$145/Sq Ft
Est. Value
About This Home
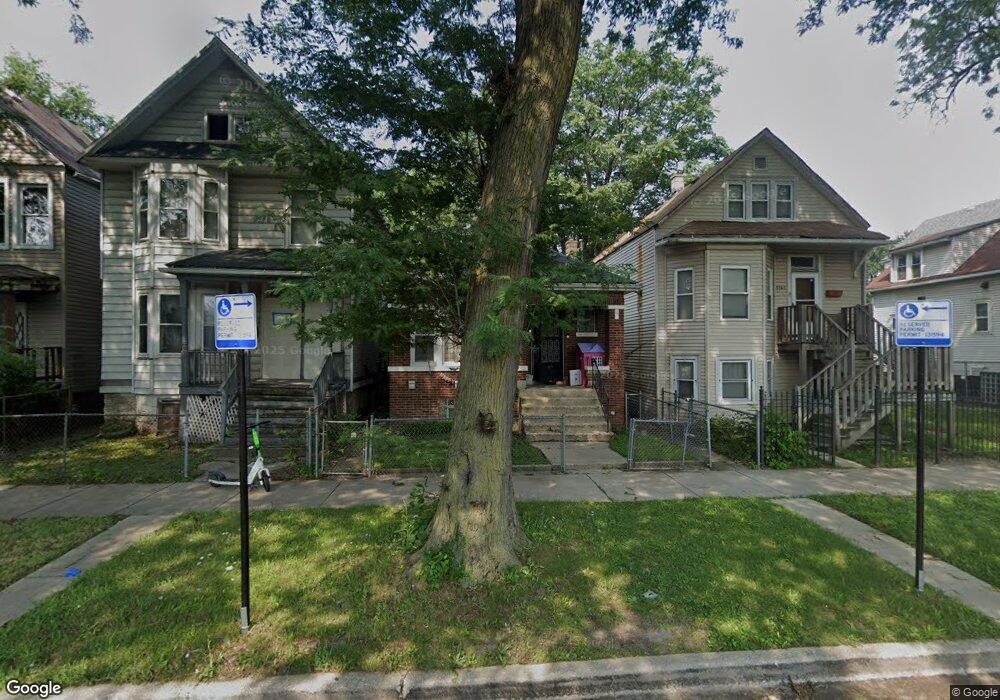
This home is located at 5746 S Marshfield Ave, Chicago, IL 60636 and is currently estimated at $108,037, approximately $145 per square foot. 5746 S Marshfield Ave is a home located in Cook County with nearby schools including A. Langford Elementary School, Providence-Englewood Elementary Charter School, and Academy of St. Benedict the African.
Create a Home Valuation Report for This Property
The Home Valuation Report is an in-depth analysis detailing your home's value as well as a comparison with similar homes in the area
Home Values in the Area
Average Home Value in this Area
Tax History Compared to Growth
Tax History
| Year | Tax Paid | Tax Assessment Tax Assessment Total Assessment is a certain percentage of the fair market value that is determined by local assessors to be the total taxable value of land and additions on the property. | Land | Improvement |
|---|---|---|---|---|
| 2024 | -- | $3,601 | $938 | $2,663 |
| 2023 | -- | $3,216 | $2,031 | $1,185 |
| 2022 | $0 | $3,216 | $2,031 | $1,185 |
| 2021 | $17 | $3,215 | $2,031 | $1,184 |
| 2020 | $17 | $6,413 | $2,031 | $4,382 |
| 2019 | $17 | $7,206 | $2,031 | $5,175 |
| 2018 | $66 | $7,206 | $2,031 | $5,175 |
| 2017 | $18 | $8,302 | $1,875 | $6,427 |
| 2016 | $805 | $8,302 | $1,875 | $6,427 |
| 2015 | $697 | $8,302 | $1,875 | $6,427 |
| 2014 | $795 | $6,853 | $1,718 | $5,135 |
| 2013 | $768 | $6,853 | $1,718 | $5,135 |
Source: Public Records
Map
Nearby Homes
- 5742 S Marshfield Ave
- 5734 S Ashland Ave
- 5750 S Paulina St
- 5752 S Paulina St
- 5812 S Marshfield Ave
- 5720 S Paulina St
- 5656 S Marshfield Ave
- 5658 S Hermitage Ave
- 5748 S Laflin St
- 5633 S Justine St
- 5922 S Paulina St
- 5711 S Laflin St
- 5924 S Paulina St
- 5538 S Ashland Ave
- 5605 S Justine St
- 5758 S Honore St
- 5935 S Justine St
- 5617 S Laflin St
- 5723 S Wolcott Ave
- 5708 S Loomis Blvd
- 5748 S Marshfield Ave
- 5742 S Marshfield Ave Unit 1
- 5750 S Marshfield Ave Unit 2
- 5750 S Marshfield Ave
- 5738 S Marshfield Ave
- 5756 S Marshfield Ave
- 5756 S Marshfield Ave
- 5736 S Marshfield Ave
- 5758 S Marshfield Ave
- 5732 S Marshfield Ave
- 5747 S Paulina St
- 5743 S Paulina St
- 5743 S Paulina St
- 5728 S Marshfield Ave
- 5755 S Paulina St
- 5741 S Paulina St
- 5741 S Paulina St
- 5737 S Paulina St
- 5737 S Paulina St
- 5757 S Paulina St