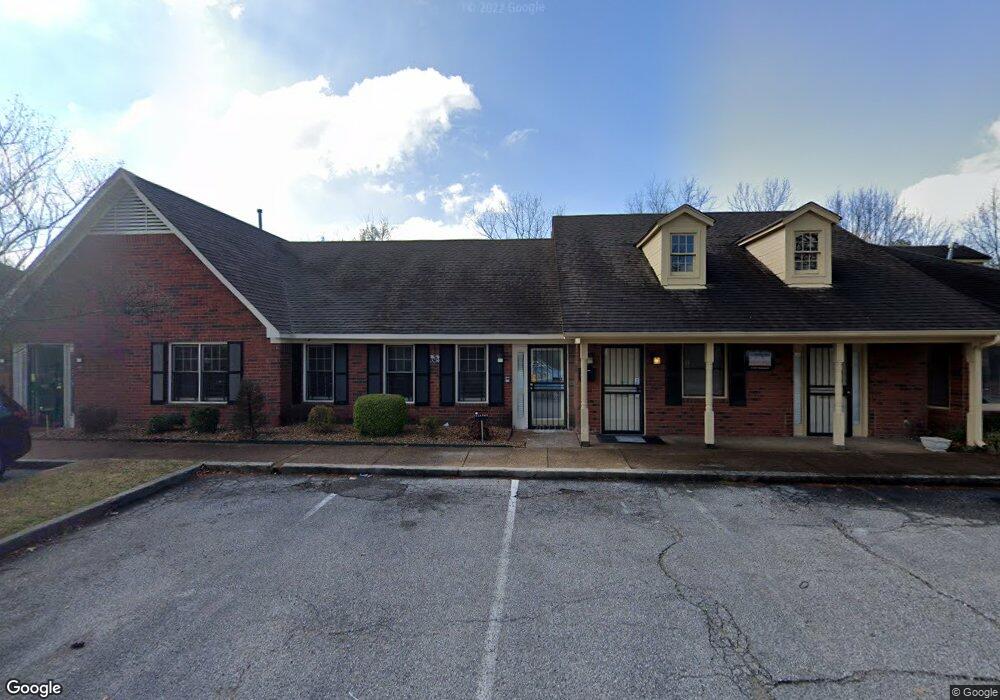
5747 Nanjack Cir Memphis, TN 38115
Fox Meadows NeighborhoodEstimated Value: $80,577
--
Bed
--
Bath
912
Sq Ft
$88/Sq Ft
Est. Value
About This Home
This home is located at 5747 Nanjack Cir, Memphis, TN 38115 and is currently estimated at $80,577, approximately $88 per square foot. 5747 Nanjack Cir is a home located in Shelby County with nearby schools including Fox Meadows Elementary School, Wooddale High School, and Cornerstone Prep School.
Ownership History
Date
Name
Owned For
Owner Type
Purchase Details
Closed on
May 8, 2024
Sold by
Harris Crystell Janinne
Bought by
Certifix Llc
Current Estimated Value
Purchase Details
Closed on
Jan 19, 2022
Sold by
Greer Tracy E and Macon Greer Renee
Bought by
Harris Crystell Janinne
Home Financials for this Owner
Home Financials are based on the most recent Mortgage that was taken out on this home.
Original Mortgage
$200,000
Interest Rate
3.11%
Mortgage Type
Purchase Money Mortgage
Purchase Details
Closed on
Nov 19, 2009
Sold by
Iberiabank Fsb
Bought by
Greer Tracy
Purchase Details
Closed on
Aug 25, 2009
Sold by
Horizon Enterprises Llc
Bought by
Iberiabank Fsb and Pulaski Bank & Trust Company
Purchase Details
Closed on
Nov 30, 2005
Sold by
Mcbride James E
Bought by
Cig Investments Llc
Purchase Details
Closed on
Sep 28, 2005
Sold by
Bank Of Bartlett
Bought by
Mcbride James E
Purchase Details
Closed on
Apr 12, 2005
Sold by
Greene Ishmel Jackson and Greene Charlotte A
Bought by
Bank Of Bartlett
Create a Home Valuation Report for This Property
The Home Valuation Report is an in-depth analysis detailing your home's value as well as a comparison with similar homes in the area
Home Values in the Area
Average Home Value in this Area
Purchase History
| Date | Buyer | Sale Price | Title Company |
|---|---|---|---|
| Certifix Llc | $80,000 | Medlock Title And Escrow | |
| Harris Crystell Janinne | $400,000 | Preferred Title & Escrow Llc | |
| Greer Tracy | $33,333 | None Available | |
| Iberiabank Fsb | $265,000 | None Available | |
| Cig Investments Llc | $63,000 | -- | |
| Mcbride James E | $40,000 | -- | |
| Bank Of Bartlett | $30,000 | -- |
Source: Public Records
Mortgage History
| Date | Status | Borrower | Loan Amount |
|---|---|---|---|
| Previous Owner | Harris Crystell Janinne | $200,000 |
Source: Public Records
Tax History Compared to Growth
Tax History
| Year | Tax Paid | Tax Assessment Tax Assessment Total Assessment is a certain percentage of the fair market value that is determined by local assessors to be the total taxable value of land and additions on the property. | Land | Improvement |
|---|---|---|---|---|
| 2025 | $465 | $30,680 | $3,520 | $27,160 |
| 2024 | $465 | $13,720 | $3,520 | $10,200 |
| 2023 | $836 | $13,720 | $3,520 | $10,200 |
| 2022 | $836 | $13,720 | $3,520 | $10,200 |
| 2021 | $846 | $13,720 | $3,520 | $10,200 |
| 2020 | $925 | $12,760 | $3,520 | $9,240 |
| 2019 | $408 | $12,760 | $3,520 | $9,240 |
| 2018 | $754 | $23,600 | $3,520 | $20,080 |
| 2017 | $772 | $23,600 | $3,520 | $20,080 |
| 2016 | $956 | $21,880 | $0 | $0 |
| 2014 | $956 | $26,040 | $0 | $0 |
Source: Public Records
Map
Nearby Homes
- 2767 Sonora Dr Unit 2
- 2771 Sonora Dr Unit 1
- 2791 Sonora Dr Unit 4
- 2782 Mojave Place Unit 1
- 2786 Mojave Place Unit 1
- 2835 Sonora Dr Unit 2
- 2831 Sonora Dr Unit 115
- 2829 Sonora Dr Unit 116D
- 2827 Sonora Dr Unit 3
- 2825 Sonora Dr Unit 1
- 5577 Gates Cove Unit 47
- 3009 Inverness Parkway Dr
- 2556 Lynnfield Rd
- 2540 Lynnfield Rd
- 3054 Inverness Parkway Dr
- 5991 Southampton Dr
- 5391 Elmhurst Ave
- 6010 Fox Ridge Dr
- 2406 Eastover Dr
- 2523 Syon Dr
- 5745 Nanjack Cir
- 5751 Nanjack Cir
- 5753 Nanjack Cir
- 5743 Nanjack Cir Unit 7
- 5743 Nanjack Cir Unit 38
- 5741 Nanjack Cir
- 5739 Nanjack Cir
- 5750 Nanjack Cir
- 5737 Nanjack Cir
- 5735 Nanjack Cir
- 5733 Nanjack Cir
- 2761 Sonora Dr Unit 154D
- 2761 Sonora Dr Unit 154U
- 2763 Sonora Dr Unit 3
- 2763 Sonora Dr Unit 4
- 2763 Sonora Dr Unit 2
- 2763 Sonora Dr Unit 153D
- 2763 Sonora Dr Unit 153U
- 2763 Sonora Dr
- 2763 Sonora Dr