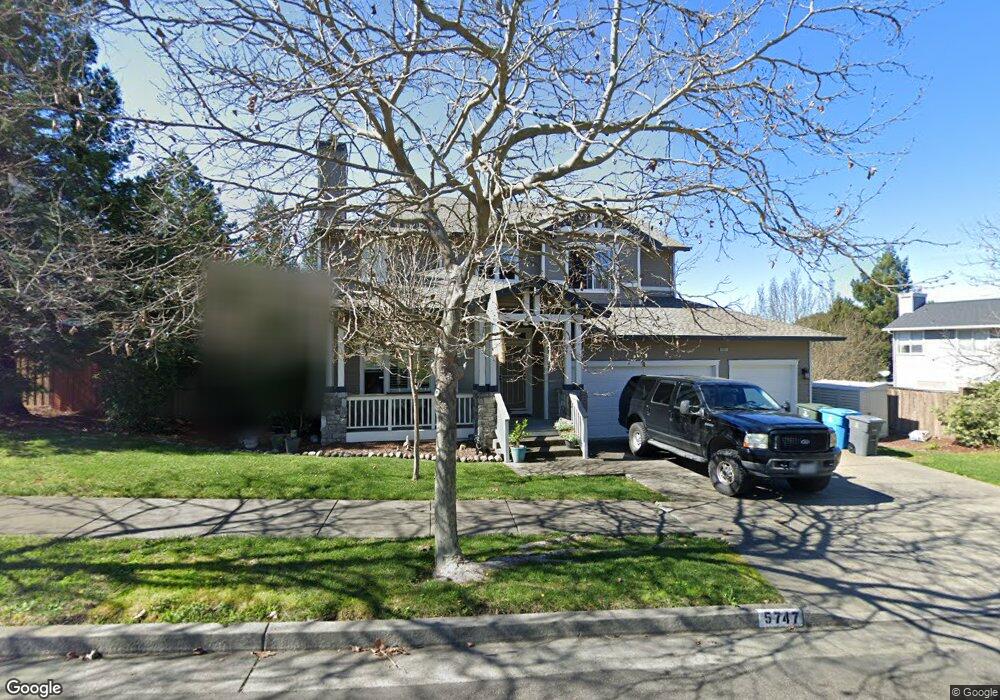
5747 Owls Nest Dr Santa Rosa, CA 95409
Skyhawk NeighborhoodEstimated Value: $1,169,000 - $1,254,000
3
Beds
3
Baths
2,823
Sq Ft
$426/Sq Ft
Est. Value
About This Home
This home is located at 5747 Owls Nest Dr, Santa Rosa, CA 95409 and is currently estimated at $1,203,646, approximately $426 per square foot. 5747 Owls Nest Dr is a home located in Sonoma County with nearby schools including Austin Creek Elementary School, Rincon Valley Middle School, and Maria Carrillo High School.
Ownership History
Date
Name
Owned For
Owner Type
Purchase Details
Closed on
Sep 17, 2021
Sold by
Titone Joseph and Titone Denise
Bought by
Jadia Llc
Current Estimated Value
Purchase Details
Closed on
May 23, 2002
Sold by
Congirlu Mahyar and Congirlu Brigette
Bought by
Titone Joseph and Titone Denise
Home Financials for this Owner
Home Financials are based on the most recent Mortgage that was taken out on this home.
Original Mortgage
$545,000
Interest Rate
6.89%
Mortgage Type
Stand Alone First
Purchase Details
Closed on
Jun 20, 1997
Sold by
Skyhawk Investors #2
Bought by
Congirlu Mahyar and Congirlu Brigette
Home Financials for this Owner
Home Financials are based on the most recent Mortgage that was taken out on this home.
Original Mortgage
$214,600
Interest Rate
7.91%
Create a Home Valuation Report for This Property
The Home Valuation Report is an in-depth analysis detailing your home's value as well as a comparison with similar homes in the area
Home Values in the Area
Average Home Value in this Area
Purchase History
| Date | Buyer | Sale Price | Title Company |
|---|---|---|---|
| Jadia Llc | -- | None Available | |
| Titone Joseph | $545,000 | Fidelity National Title Co | |
| Congirlu Mahyar | $330,000 | North Bay Title Co |
Source: Public Records
Mortgage History
| Date | Status | Borrower | Loan Amount |
|---|---|---|---|
| Previous Owner | Titone Joseph | $545,000 | |
| Previous Owner | Congirlu Mahyar | $214,600 |
Source: Public Records
Tax History Compared to Growth
Tax History
| Year | Tax Paid | Tax Assessment Tax Assessment Total Assessment is a certain percentage of the fair market value that is determined by local assessors to be the total taxable value of land and additions on the property. | Land | Improvement |
|---|---|---|---|---|
| 2025 | $9,615 | $829,305 | $258,525 | $570,780 |
| 2024 | $9,615 | $813,045 | $253,456 | $559,589 |
| 2023 | $9,615 | $797,104 | $248,487 | $548,617 |
| 2022 | $8,801 | $781,475 | $243,615 | $537,860 |
| 2021 | $8,627 | $766,153 | $238,839 | $527,314 |
| 2020 | $8,594 | $758,298 | $236,390 | $521,908 |
| 2019 | $8,515 | $743,430 | $231,755 | $511,675 |
| 2018 | $9,337 | $728,854 | $227,211 | $501,643 |
| 2017 | $9,275 | $714,563 | $222,756 | $491,807 |
| 2016 | $9,197 | $700,553 | $218,389 | $482,164 |
| 2015 | $8,946 | $690,031 | $215,109 | $474,922 |
| 2014 | $8,644 | $676,515 | $210,896 | $465,619 |
Source: Public Records
Map
Nearby Homes
- 5794 Owl Hill Ave
- 5741 Evening Way
- 5534 Rainbow Cir
- 5518 Marit Dr
- 5682 Raters Dr
- 184 El Encanto Way
- 5388 Sonoma Hwy
- 5969 Vista Ridge
- 5644 Eastlake Dr
- 5985 Vista Ridge
- 5980 Vista Ridge
- 5411 Yerba Buena Rd
- 1826 San Ramon Way
- 5056 Fravel Ln
- 5088 Firestone Ct
- 5974 Sunhawk Dr
- 5426 Spring Lake Ct
- 615 Montclair Dr
- 5907 Mountain Hawk Dr
- 305 Simone Place N
- 5743 Owls Nest Dr
- 5758 Desoto Dr
- 5762 Desoto Dr
- 5754 Desoto Dr
- 5754 De Soto Dr
- 4 Quixote Ct
- 5739 Owls Nest Dr
- 5761 Owl Light Terrace
- 5760 Owl Light Terrace
- 2 Quixote Ct
- 5766 Desoto Dr
- 5 Quixote Ct
- 5735 Owls Nest Dr
- 5757 De Soto Dr
- 5763 Owl Light Terrace
- 5761 Desoto Dr
- 5757 Desoto Dr
- 5763 Owl Hill Ave
- 5762 Owl Light Terrace
- 5753 Desoto Dr