Estimated Value: $212,286 - $236,000
2
Beds
2
Baths
1,228
Sq Ft
$183/Sq Ft
Est. Value
About This Home
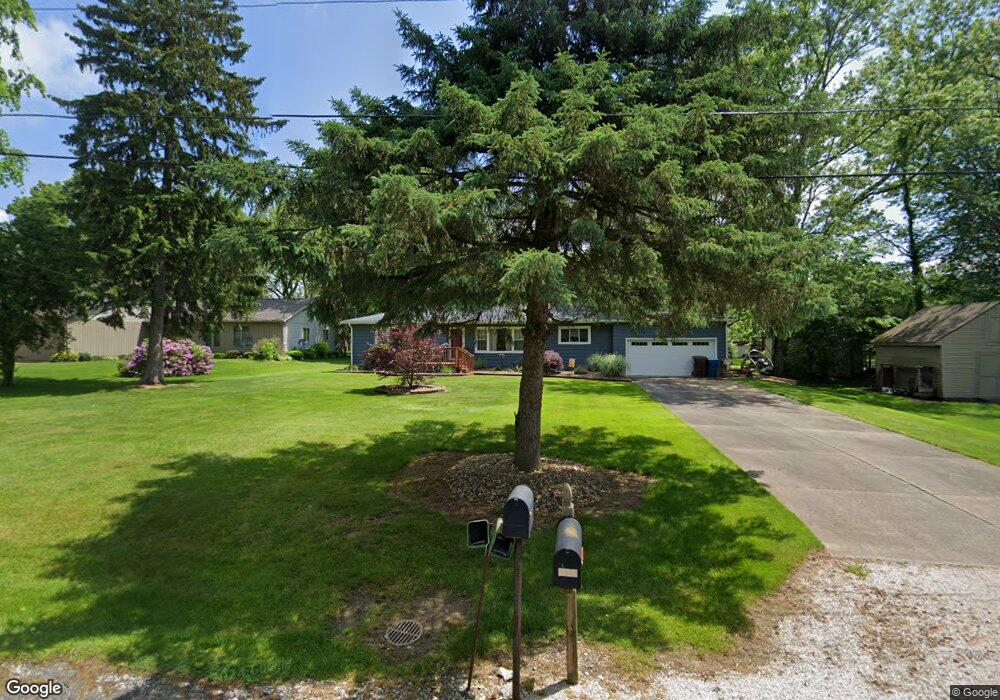
This home is located at 5747 Towerview Dr, Akron, OH 44319 and is currently estimated at $224,322, approximately $182 per square foot. 5747 Towerview Dr is a home located in Summit County with nearby schools including Manchester Middle School, Nolley Elementary School, and Manchester High School.
Ownership History
Date
Name
Owned For
Owner Type
Purchase Details
Closed on
Jul 10, 2002
Sold by
Krunich Jerome D
Bought by
Cool Dickie L and Cool Marjean A
Current Estimated Value
Home Financials for this Owner
Home Financials are based on the most recent Mortgage that was taken out on this home.
Original Mortgage
$110,400
Outstanding Balance
$47,066
Interest Rate
6.79%
Estimated Equity
$177,256
Purchase Details
Closed on
May 9, 2001
Sold by
Krunich Lesa L
Bought by
Krunich Jerome D
Home Financials for this Owner
Home Financials are based on the most recent Mortgage that was taken out on this home.
Original Mortgage
$71,500
Interest Rate
7.02%
Purchase Details
Closed on
Jul 14, 1994
Sold by
Pelt Andrew
Bought by
Krunich Jerome D and Krunich Lesa L
Home Financials for this Owner
Home Financials are based on the most recent Mortgage that was taken out on this home.
Original Mortgage
$76,000
Interest Rate
6.5%
Mortgage Type
New Conventional
Create a Home Valuation Report for This Property
The Home Valuation Report is an in-depth analysis detailing your home's value as well as a comparison with similar homes in the area
Home Values in the Area
Average Home Value in this Area
Purchase History
| Date | Buyer | Sale Price | Title Company |
|---|---|---|---|
| Cool Dickie L | $129,900 | Miller Examining Service Inc | |
| Krunich Jerome D | -- | Guardian Title | |
| Krunich Jerome D | $80,000 | -- |
Source: Public Records
Mortgage History
| Date | Status | Borrower | Loan Amount |
|---|---|---|---|
| Open | Cool Dickie L | $110,400 | |
| Previous Owner | Krunich Jerome D | $71,500 | |
| Previous Owner | Krunich Jerome D | $76,000 |
Source: Public Records
Tax History Compared to Growth
Tax History
| Year | Tax Paid | Tax Assessment Tax Assessment Total Assessment is a certain percentage of the fair market value that is determined by local assessors to be the total taxable value of land and additions on the property. | Land | Improvement |
|---|---|---|---|---|
| 2025 | $2,550 | $60,246 | $11,809 | $48,437 |
| 2024 | $2,550 | $60,246 | $11,809 | $48,437 |
| 2023 | $2,550 | $60,246 | $11,809 | $48,437 |
| 2022 | $3,072 | $47,943 | $9,373 | $38,570 |
| 2021 | $3,083 | $47,943 | $9,373 | $38,570 |
| 2020 | $3,030 | $47,940 | $9,370 | $38,570 |
| 2019 | $2,812 | $39,870 | $9,370 | $30,500 |
| 2018 | $2,426 | $39,870 | $9,370 | $30,500 |
| 2017 | $2,324 | $39,870 | $9,370 | $30,500 |
| 2016 | $2,297 | $34,610 | $9,370 | $25,240 |
| 2015 | $2,324 | $34,610 | $9,370 | $25,240 |
| 2014 | $2,306 | $34,610 | $9,370 | $25,240 |
| 2013 | $2,447 | $36,940 | $9,370 | $27,570 |
Source: Public Records
Map
Nearby Homes
- 5737 Towerview Dr
- 877 W Nimisila Rd
- 715 Highland Park Dr
- 1062 Stump Rd
- 427 Center Rd
- 6412 Lieb Dr
- 6407 Southview Dr
- 809 Zeletta Dr
- 4999 Peggy Ann Dr
- 4944 Coleman Dr
- 4927 Coleman Dr
- 4869 Coleman Dr
- S/L 14,15 Shakes Hotel Dr
- 0 W Comet Rd Unit 5079117
- 6 Shrakes Hotel Dr
- 4 Shrakes Hotel Dr
- 7 Shrakes Hotel Dr
- 5 Shrakes Hotel Dr
- 3 Shrakes Hotel Dr
- 4881 S Main St
- 715 Pearlman Rd
- 725 Pearlman Rd
- 5727 Towerview Dr
- 705 Pearlman Rd
- 695 Pearlman Rd
- 739 Pearlman Rd
- 5717 Towerview Dr
- 5748 Towerview Dr
- 5738 Towerview Dr
- 685 Pearlman Rd
- 5654 Bonnie Lou Dr
- 5728 Towerview Dr
- 749 Pearlman Rd
- 5707 Towerview Dr
- 5718 Towerview Dr
- 677 Pearlman Rd
- 5662 Bonnie Lou Dr
- 5646 Bonnie Lou Dr
- 714 Pearlman Rd
- 753 Pearlman Rd