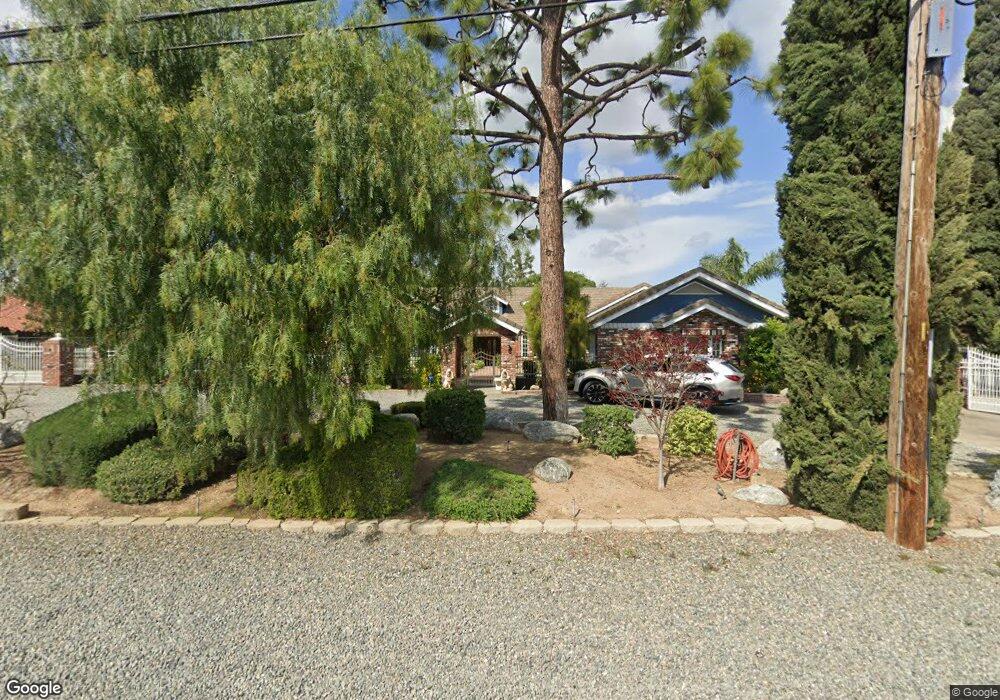
5748 Grandview Ave Yorba Linda, CA 92886
Estimated Value: $2,697,000 - $3,882,000
4
Beds
5
Baths
4,854
Sq Ft
$675/Sq Ft
Est. Value
About This Home
This home is located at 5748 Grandview Ave, Yorba Linda, CA 92886 and is currently estimated at $3,274,790, approximately $674 per square foot. 5748 Grandview Ave is a home located in Orange County with nearby schools including Linda Vista Elementary School, Yorba Linda Middle School, and Friends Christian School.
Ownership History
Date
Name
Owned For
Owner Type
Purchase Details
Closed on
Apr 22, 2010
Sold by
The Stone Family Trust
Bought by
Bailey Don Matthew and Bailey Linda Reed
Current Estimated Value
Purchase Details
Closed on
Jul 30, 2004
Sold by
Stone Michael W and Stone Joann D
Bought by
Stone Michael W and Stone Joann D
Purchase Details
Closed on
Mar 2, 1998
Sold by
Carrie Smeltzer
Bought by
Stone Michael W and Stone Jo Ann D
Home Financials for this Owner
Home Financials are based on the most recent Mortgage that was taken out on this home.
Original Mortgage
$276,000
Interest Rate
7.12%
Purchase Details
Closed on
Feb 17, 1998
Sold by
Carrie Smeltzer and Carrie Christina L
Bought by
Smeltzer Carrie L
Home Financials for this Owner
Home Financials are based on the most recent Mortgage that was taken out on this home.
Original Mortgage
$276,000
Interest Rate
7.12%
Create a Home Valuation Report for This Property
The Home Valuation Report is an in-depth analysis detailing your home's value as well as a comparison with similar homes in the area
Home Values in the Area
Average Home Value in this Area
Purchase History
| Date | Buyer | Sale Price | Title Company |
|---|---|---|---|
| Bailey Don Matthew | $1,600,000 | Fidelity National Title Co | |
| Stone Michael W | -- | -- | |
| Stone Michael W | $345,000 | Fidelity National Title Ins | |
| Smeltzer Carrie L | -- | Fidelity National Title Co | |
| Smeltzer Carrie L | -- | Fidelity National Title Ins | |
| Coyne Christina L | -- | Fidelity National Title Ins |
Source: Public Records
Mortgage History
| Date | Status | Borrower | Loan Amount |
|---|---|---|---|
| Previous Owner | Stone Michael W | $276,000 | |
| Closed | Stone Michael W | $34,500 |
Source: Public Records
Tax History Compared to Growth
Tax History
| Year | Tax Paid | Tax Assessment Tax Assessment Total Assessment is a certain percentage of the fair market value that is determined by local assessors to be the total taxable value of land and additions on the property. | Land | Improvement |
|---|---|---|---|---|
| 2025 | $19,805 | $1,856,200 | $928,435 | $927,765 |
| 2024 | $19,805 | $1,819,804 | $910,230 | $909,574 |
| 2023 | $19,480 | $1,784,122 | $892,382 | $891,740 |
| 2022 | $19,321 | $1,749,140 | $874,885 | $874,255 |
| 2021 | $19,002 | $1,714,844 | $857,731 | $857,113 |
| 2020 | $18,948 | $1,697,261 | $848,936 | $848,325 |
| 2019 | $18,255 | $1,663,982 | $832,290 | $831,692 |
| 2018 | $18,032 | $1,631,355 | $815,970 | $815,385 |
| 2017 | $17,737 | $1,599,368 | $799,970 | $799,398 |
| 2016 | $17,376 | $1,568,008 | $784,284 | $783,724 |
| 2015 | $17,168 | $1,544,456 | $772,504 | $771,952 |
| 2014 | $16,652 | $1,514,203 | $757,372 | $756,831 |
Source: Public Records
Map
Nearby Homes
- 5729 Grandview Ave
- 5754 Kellogg Dr
- 5861 Sunmist Dr
- 6041 Calle Mirador
- 5371 Grandview Ave
- 5335 Grandview Ave
- 18571 Buena Vista Ave
- 18931 Gordon Ln
- 5245 Grandview Ave
- 1891 N Garland Ln
- 5018 E Budlong St
- 5031 Fairway View Dr
- 19701 Parkview Terrace
- 5152 Lakeview Ave
- 18501 Woodwind Ln
- 19762 Ridgewood Place
- 6052 Candle Light Ln
- 6025 Kingsbriar Dr
- 4951 Oak Tree Ct
- 1760 N Oak Knoll Dr Unit B
- 5744 Grandview Ave
- 5762 Grandview Ave
- 5757 Orchard Kellogg Dr
- 5757 Kellogg Dr
- 5732 Grandview Ave
- 5771 Grandview Ave
- 5772 Grandview Ave
- 5672 Grandview Ave
- 19002 Shamrock Ln
- 5722 Grandview Ave
- 19022 Shamrock Ln
- 5801 Grandview Ave
- 5678 Grandview Ave
- 5792 Grandview Ave
- 5771 Kellogg Dr
- 5682 Grandview Ave
- 5712 Grandview Ave
- 19021 Shamrock Ln
- 5811 Grandview Ave
- 19042 Shamrock Ln