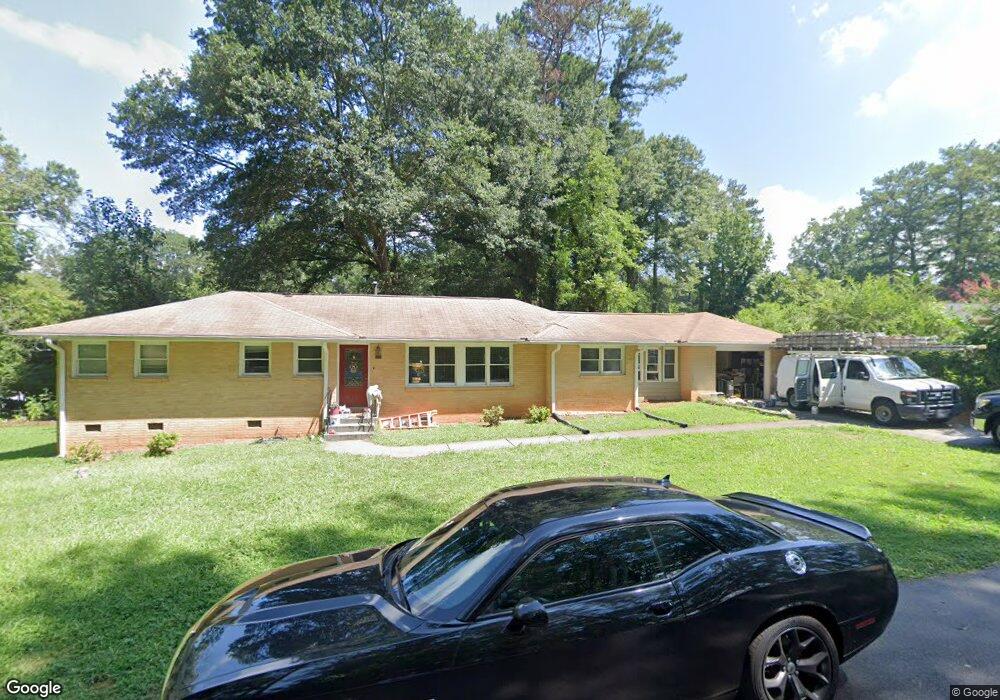
575 Boyds Dr SE Marietta, GA 30067
Powers Park NeighborhoodEstimated Value: $272,000 - $380,922
4
Beds
4
Baths
1,580
Sq Ft
$215/Sq Ft
Est. Value
About This Home
This home is located at 575 Boyds Dr SE, Marietta, GA 30067 and is currently estimated at $339,231, approximately $214 per square foot. 575 Boyds Dr SE is a home located in Cobb County with nearby schools including Powers Ferry Elementary School, East Cobb Middle School, and Wheeler High School.
Ownership History
Date
Name
Owned For
Owner Type
Purchase Details
Closed on
Dec 29, 2017
Sold by
Romig Paul
Bought by
Rainey Lisa K
Current Estimated Value
Home Financials for this Owner
Home Financials are based on the most recent Mortgage that was taken out on this home.
Original Mortgage
$142,373
Outstanding Balance
$120,419
Interest Rate
4.12%
Mortgage Type
FHA
Estimated Equity
$218,812
Purchase Details
Closed on
Feb 25, 2005
Sold by
Draisen Adam
Bought by
Draisen Adam and Draisen Kim
Home Financials for this Owner
Home Financials are based on the most recent Mortgage that was taken out on this home.
Original Mortgage
$17,200
Interest Rate
5.61%
Mortgage Type
New Conventional
Purchase Details
Closed on
Sep 30, 1997
Sold by
Jackson Carrol W
Bought by
Jackson William S and Jackson Shelley G
Home Financials for this Owner
Home Financials are based on the most recent Mortgage that was taken out on this home.
Original Mortgage
$99,489
Interest Rate
7.6%
Mortgage Type
FHA
Create a Home Valuation Report for This Property
The Home Valuation Report is an in-depth analysis detailing your home's value as well as a comparison with similar homes in the area
Home Values in the Area
Average Home Value in this Area
Purchase History
| Date | Buyer | Sale Price | Title Company |
|---|---|---|---|
| Rainey Lisa K | $145,000 | -- | |
| Rainey Lisa K | -- | -- | |
| Draisen Adam | -- | -- | |
| Jackson William S | $101,900 | -- |
Source: Public Records
Mortgage History
| Date | Status | Borrower | Loan Amount |
|---|---|---|---|
| Open | Rainey Lisa K | $142,373 | |
| Closed | Rainey Lisa K | $142,373 | |
| Previous Owner | Draisen Adam | $17,200 | |
| Previous Owner | Jackson William S | $99,489 |
Source: Public Records
Tax History Compared to Growth
Tax History
| Year | Tax Paid | Tax Assessment Tax Assessment Total Assessment is a certain percentage of the fair market value that is determined by local assessors to be the total taxable value of land and additions on the property. | Land | Improvement |
|---|---|---|---|---|
| 2025 | $4,143 | $137,496 | $32,000 | $105,496 |
| 2024 | $4,146 | $137,496 | $32,000 | $105,496 |
| 2023 | $4,146 | $137,496 | $32,000 | $105,496 |
| 2022 | $2,820 | $92,904 | $24,000 | $68,904 |
| 2021 | $2,820 | $92,904 | $24,000 | $68,904 |
| 2020 | $2,350 | $77,436 | $24,000 | $53,436 |
| 2019 | $2,099 | $69,160 | $20,000 | $49,160 |
| 2018 | $1,760 | $58,000 | $18,520 | $39,480 |
| 2017 | $1,800 | $62,604 | $20,000 | $42,604 |
| 2016 | $1,600 | $55,644 | $16,000 | $39,644 |
| 2015 | $1,123 | $38,124 | $8,000 | $30,124 |
| 2014 | $951 | $31,996 | $0 | $0 |
Source: Public Records
Map
Nearby Homes
- 470 Oriole Dr SE
- 1051 Oriole Ln SE
- 706 Twin Brooks Ct SE
- 2059 Clearwater Dr SE
- 402 Terrydale Dr SE
- 369 Virginia Place SE
- 349 Virginia Place SE
- 2182 Freydale Rd SE
- 3155 Woodberry Ln SE
- 1722 Crestridge Dr SE
- 1824 Crestridge Dr SE
- 1785 Crestridge Dr SE
- 1664 Crestridge Dr SE
- 1923 Clearwater Dr SE
- 306 Augusta Dr SE
- 2107 Augusta Dr SE
- 1703 Augusta Dr SE
- 567 Boyds Dr SE
- 0 Boyds Dr SE Unit 7196424
- 0 Boyds Dr SE Unit 8863183
- 0 Boyds Dr SE Unit 8612592
- 0 Boyds Dr SE Unit 8025686
- 0 Boyds Dr SE
- 576 Lyle Dr SE
- 584 Boyds Dr SE
- 557 Boyds Dr SE
- 566 Lyle Dr SE
- 582 Boyds Dr SE
- 578 Boyds Dr SE
- 586 Boyds Dr SE
- 568 Boyds Dr SE
- 558 Lyle Dr SE
- 580 Boyds Dr SE
- 558 Boyds Dr SE
- 547 Boyds Dr SE
- 606 Lyle Dr SE
- 548 Lyle Dr SE