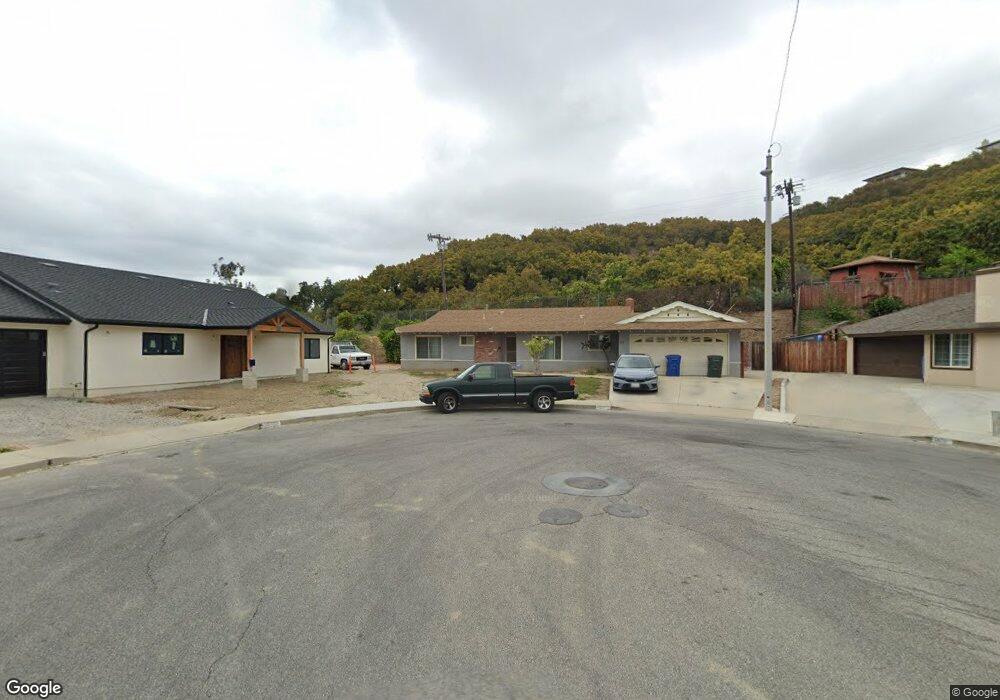
575 Bradley St Santa Paula, CA 93060
Estimated Value: $655,833 - $712,000
3
Beds
2
Baths
1,218
Sq Ft
$563/Sq Ft
Est. Value
About This Home
This home is located at 575 Bradley St, Santa Paula, CA 93060 and is currently estimated at $685,708, approximately $562 per square foot. 575 Bradley St is a home located in Ventura County with nearby schools including McKevett Elementary School, Isbell Middle, and Santa Paula High.
Ownership History
Date
Name
Owned For
Owner Type
Purchase Details
Closed on
Dec 20, 2012
Sold by
Barker Howard Eugene and Barker John Douglas
Bought by
Barker John Douglas
Current Estimated Value
Home Financials for this Owner
Home Financials are based on the most recent Mortgage that was taken out on this home.
Original Mortgage
$177,000
Outstanding Balance
$122,053
Interest Rate
3.27%
Mortgage Type
New Conventional
Estimated Equity
$563,655
Purchase Details
Closed on
Apr 30, 2012
Sold by
Barker Kimberly Ann
Bought by
Barker Howard Eugene and Barker John Douglas
Purchase Details
Closed on
Aug 17, 2011
Sold by
Barker Mary E
Bought by
Barker Mary E
Purchase Details
Closed on
Jan 21, 2011
Sold by
Barker Mary E
Bought by
Barker Mary E
Purchase Details
Closed on
Aug 23, 1999
Sold by
Sims Geneva O
Bought by
Sims Geneva O
Create a Home Valuation Report for This Property
The Home Valuation Report is an in-depth analysis detailing your home's value as well as a comparison with similar homes in the area
Home Values in the Area
Average Home Value in this Area
Purchase History
| Date | Buyer | Sale Price | Title Company |
|---|---|---|---|
| Barker John Douglas | -- | First American Title Company | |
| Barker Howard Eugene | -- | First American Title Company | |
| Barker Howard Eugene | -- | None Available | |
| Barker Mary E | -- | None Available | |
| Barker Mary E | -- | None Available | |
| Sims Geneva O | -- | -- |
Source: Public Records
Mortgage History
| Date | Status | Borrower | Loan Amount |
|---|---|---|---|
| Open | Barker Howard Eugene | $177,000 |
Source: Public Records
Tax History Compared to Growth
Tax History
| Year | Tax Paid | Tax Assessment Tax Assessment Total Assessment is a certain percentage of the fair market value that is determined by local assessors to be the total taxable value of land and additions on the property. | Land | Improvement |
|---|---|---|---|---|
| 2025 | $2,198 | $194,091 | $72,596 | $121,495 |
| 2024 | $2,198 | $190,286 | $71,173 | $119,113 |
| 2023 | $2,152 | $186,555 | $69,777 | $116,778 |
| 2022 | $2,088 | $182,898 | $68,409 | $114,489 |
| 2021 | $2,081 | $179,312 | $67,067 | $112,245 |
| 2020 | $2,070 | $177,475 | $66,380 | $111,095 |
| 2019 | $1,958 | $173,996 | $65,079 | $108,917 |
| 2018 | $1,933 | $170,585 | $63,803 | $106,782 |
| 2017 | $1,954 | $167,241 | $62,552 | $104,689 |
| 2016 | $1,838 | $163,963 | $61,326 | $102,637 |
| 2015 | $1,756 | $161,502 | $60,405 | $101,097 |
| 2014 | $1,783 | $158,340 | $59,223 | $99,117 |
Source: Public Records
Map
Nearby Homes
- 179 View Dr
- 100 E Virginia Terrace
- 0 View Dr Unit V1-32228
- 370 E View Dr
- 421 N Palm Ave
- 0 Dickenson Rd
- 1848 Jojoba Dr
- 413 Checkerbloom Ln
- 1856 Jojoba Dr
- 1865 Jojoba Dr
- 455 Snowdrop Ln
- 457 Snowdrop Ln
- 275 Fuerte Dr
- 428 Anacapa Terrace
- 864 Montclair Dr
- 362 W Santa Barbara St
- 107 Sonoma Ln
- 324 W Santa Barbara St
- 738 E Santa Paula St
- 919 E Virginia Terrace
- 578 Bradley St
- 569 Bradley St
- 147 E View Dr
- 147 E View Dr
- 572 Howie Ct
- 563 Bradley St
- 566 Howie Ct
- 557 Bradley St
- 569 Howie Ct
- 125 E View Dr
- 560 Howie Ct
- 11801 Santa Paula Ojai Rd
- 12209 Santa Paula Ojai Rd
- 12258 Santa Paula Ojai Rd
- 11299 Santa Paula Ojai Rd
- 548 Bradley St
- 563 Howie Ct
- 0 Garcia St
- 554 Howie Ct
- 545 Howie Ct