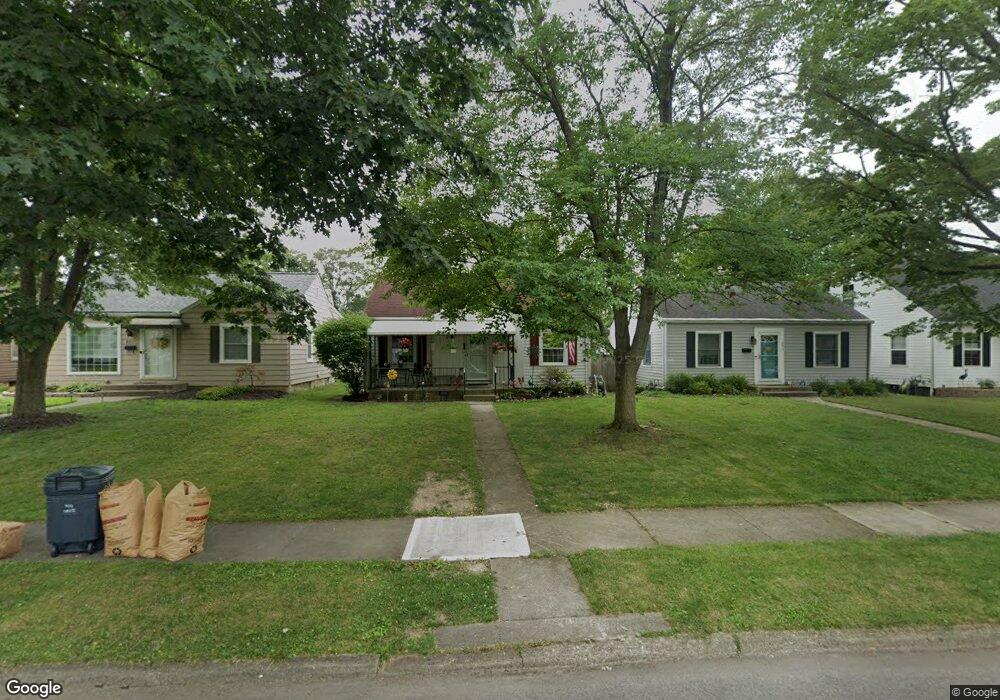
575 E Royal Forest Blvd Columbus, OH 43214
Clintonville NeighborhoodEstimated Value: $274,495 - $309,000
2
Beds
1
Bath
756
Sq Ft
$390/Sq Ft
Est. Value
About This Home
This home is located at 575 E Royal Forest Blvd, Columbus, OH 43214 and is currently estimated at $294,624, approximately $389 per square foot. 575 E Royal Forest Blvd is a home located in Franklin County with nearby schools including Colerain Elementary School, Dominion Middle School, and Whetstone High School.
Ownership History
Date
Name
Owned For
Owner Type
Purchase Details
Closed on
Jul 6, 2004
Sold by
Garcia Castro Claudio and Garcia Tracy F
Bought by
Brickner Cynthia M
Current Estimated Value
Home Financials for this Owner
Home Financials are based on the most recent Mortgage that was taken out on this home.
Original Mortgage
$134,792
Outstanding Balance
$66,284
Interest Rate
6.42%
Mortgage Type
FHA
Estimated Equity
$228,340
Purchase Details
Closed on
Jul 3, 2001
Sold by
Monett Lois A and Hartence C Monett Trust
Bought by
Garcia Castro Claudio and Garcia Tracy F
Home Financials for this Owner
Home Financials are based on the most recent Mortgage that was taken out on this home.
Original Mortgage
$112,106
Interest Rate
7.22%
Mortgage Type
FHA
Purchase Details
Closed on
Mar 11, 1999
Sold by
Monett Hartense
Bought by
Monett Hartence C and Hartence C Monett Trust
Purchase Details
Closed on
Mar 1, 1999
Sold by
Estate Of Leo R Monett
Bought by
Monett Hartence C
Purchase Details
Closed on
Nov 12, 1970
Bought by
Monett Leo R and Monett Hortense
Create a Home Valuation Report for This Property
The Home Valuation Report is an in-depth analysis detailing your home's value as well as a comparison with similar homes in the area
Home Values in the Area
Average Home Value in this Area
Purchase History
| Date | Buyer | Sale Price | Title Company |
|---|---|---|---|
| Brickner Cynthia M | $136,800 | Northwest T | |
| Garcia Castro Claudio | $113,000 | Chicago Title | |
| Monett Hartence C | -- | -- | |
| Monett Hartence C | -- | -- | |
| Monett Leo R | -- | -- |
Source: Public Records
Mortgage History
| Date | Status | Borrower | Loan Amount |
|---|---|---|---|
| Open | Brickner Cynthia M | $134,792 | |
| Previous Owner | Garcia Castro Claudio | $112,106 |
Source: Public Records
Tax History
| Year | Tax Paid | Tax Assessment Tax Assessment Total Assessment is a certain percentage of the fair market value that is determined by local assessors to be the total taxable value of land and additions on the property. | Land | Improvement |
|---|---|---|---|---|
| 2025 | $3,819 | $85,090 | $41,300 | $43,790 |
| 2024 | $3,819 | $85,090 | $41,300 | $43,790 |
| 2023 | $3,770 | $85,085 | $41,300 | $43,785 |
| 2022 | $3,105 | $59,860 | $25,030 | $34,830 |
| 2021 | $3,110 | $59,860 | $25,030 | $34,830 |
| 2020 | $3,114 | $59,860 | $25,030 | $34,830 |
| 2019 | $2,803 | $46,200 | $19,250 | $26,950 |
| 2018 | $2,617 | $46,200 | $19,250 | $26,950 |
| 2017 | $2,743 | $46,200 | $19,250 | $26,950 |
| 2016 | $2,685 | $40,530 | $16,100 | $24,430 |
| 2015 | $2,437 | $40,530 | $16,100 | $24,430 |
| 2014 | $2,443 | $40,530 | $16,100 | $24,430 |
| 2013 | $1,148 | $38,605 | $15,330 | $23,275 |
Source: Public Records
Map
Nearby Homes
- 522 E Beechwold Blvd
- 327 E Jeffrey Place
- 4615 Glenmawr Ave
- 4605 Glenmawr Ave
- 968 Garden Rd
- 4231 Glenmawr Ave Unit 233
- 4320 Sandy Lane Rd
- 899 Meadowview Dr
- 243 E Schreyer Place
- 1116 Marland Dr N
- 151 W Dominion Blvd
- 5301 Indianola Ave
- 4737 Maize Rd
- 1130 Carbone Dr
- 468 E Lincoln Ave
- 547 Chase Rd
- 952 Minerva Ave
- 627 S Selby Blvd
- 867 Overbrook Service Dr
- 131 E Stanton Ave
- 581 E Royal Forest Blvd
- 571 E Royal Forest Blvd
- 563 E Royal Forest Blvd
- 587 E Royal Forest Blvd
- 557 E Royal Forest Blvd
- 576 E Beechwold Blvd
- 570 E Beechwold Blvd
- 582 E Beechwold Blvd
- 564 E Beechwold Blvd
- 597 E Royal Forest Blvd
- 553 E Royal Forest Blvd
- 586 E Beechwold Blvd
- 576 E Royal Forest Blvd
- 560 E Beechwold Blvd
- 580 E Royal Forest Blvd
- 592 E Beechwold Blvd
- 572 E Royal Forest Blvd
- 586 E Royal Forest Blvd
- 549 E Royal Forest Blvd
- 601 E Royal Forest Blvd
Your Personal Tour Guide
Ask me questions while you tour the home.