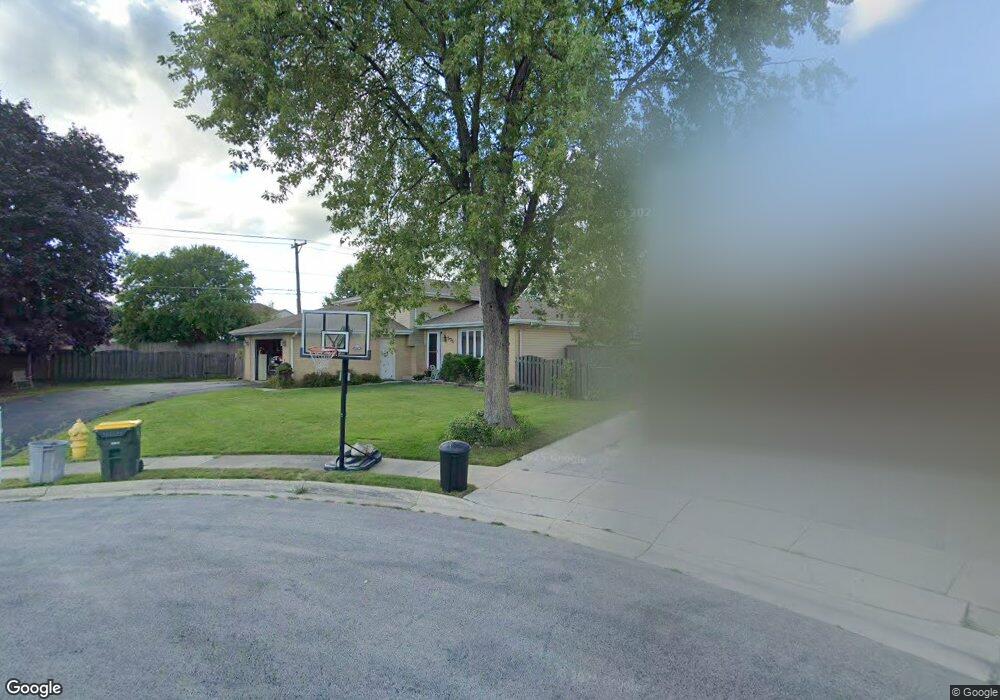
575 Fawn Ct Carol Stream, IL 60188
Estimated Value: $384,189 - $398,000
3
Beds
2
Baths
1,985
Sq Ft
$196/Sq Ft
Est. Value
About This Home
This home is located at 575 Fawn Ct, Carol Stream, IL 60188 and is currently estimated at $390,047, approximately $196 per square foot. 575 Fawn Ct is a home located in DuPage County with nearby schools including Field Kindergarten Center, Western Trails Elementary School, and Jay Stream Middle School.
Ownership History
Date
Name
Owned For
Owner Type
Purchase Details
Closed on
Jun 24, 2005
Sold by
Pietanza Jenny N and Pietanza Vito
Bought by
Vazquez Rodrigo and Vazquez Maria C
Current Estimated Value
Home Financials for this Owner
Home Financials are based on the most recent Mortgage that was taken out on this home.
Original Mortgage
$187,500
Outstanding Balance
$97,571
Interest Rate
5.71%
Mortgage Type
Fannie Mae Freddie Mac
Estimated Equity
$292,476
Purchase Details
Closed on
Jan 31, 2002
Sold by
Lukowski Leo J and Lukowski Shirley C
Bought by
Kaufman Jenny N and Pietanza Vito
Home Financials for this Owner
Home Financials are based on the most recent Mortgage that was taken out on this home.
Original Mortgage
$175,950
Interest Rate
7.14%
Create a Home Valuation Report for This Property
The Home Valuation Report is an in-depth analysis detailing your home's value as well as a comparison with similar homes in the area
Home Values in the Area
Average Home Value in this Area
Purchase History
| Date | Buyer | Sale Price | Title Company |
|---|---|---|---|
| Vazquez Rodrigo | $287,500 | Pntn | |
| Kaufman Jenny N | $207,000 | -- |
Source: Public Records
Mortgage History
| Date | Status | Borrower | Loan Amount |
|---|---|---|---|
| Open | Vazquez Rodrigo | $187,500 | |
| Previous Owner | Kaufman Jenny N | $175,950 |
Source: Public Records
Tax History Compared to Growth
Tax History
| Year | Tax Paid | Tax Assessment Tax Assessment Total Assessment is a certain percentage of the fair market value that is determined by local assessors to be the total taxable value of land and additions on the property. | Land | Improvement |
|---|---|---|---|---|
| 2024 | $8,580 | $116,009 | $32,903 | $83,106 |
| 2023 | $8,050 | $106,090 | $30,090 | $76,000 |
| 2022 | $8,709 | $105,400 | $29,890 | $75,510 |
| 2021 | $8,280 | $100,140 | $28,400 | $71,740 |
| 2020 | $8,133 | $97,700 | $27,710 | $69,990 |
| 2019 | $7,805 | $93,890 | $26,630 | $67,260 |
| 2018 | $7,315 | $84,740 | $25,930 | $58,810 |
| 2017 | $6,913 | $78,540 | $24,030 | $54,510 |
| 2016 | $6,543 | $72,690 | $22,240 | $50,450 |
| 2015 | $6,390 | $67,830 | $20,750 | $47,080 |
| 2014 | $6,349 | $66,320 | $20,290 | $46,030 |
| 2013 | $6,386 | $68,590 | $20,980 | $47,610 |
Source: Public Records
Map
Nearby Homes
- 852 Napa St
- 351 Juniper Ct
- 720 Hoover Dr Unit 124
- 654 Tacoma Dr
- 911 Hampton Dr
- 975 Merbach Ct
- 312 Dancing Water Ct
- 1065 Brighton Dr
- 787 Daybreak Ln Unit 207
- 515 Dakota Ct
- 526 Alton Ct
- 969 Dearborn Cir
- 848 Birchbark Trail
- 601 Bluff St
- 716 Sand Creek Dr
- 686 Legends Dr
- 552 Cochise Place
- 716 Shining Water Dr
- 332 El Paso Ln
- 403 Arrowhead Trail
- 569 Fawn Ct
- 828 Yellowstone St
- 574 Fawn Ct
- 563 Fawn Ct
- 568 Fawn Ct
- 836 Yellowstone St
- 829 Yellowstone St
- 825 Renaissance Dr
- 821 Renaissance Dr
- 562 Fawn Ct
- 559 Fawn Ct
- 829 Renaissance Dr
- 842 Yellowstone St
- 790 Erie Ct
- 837 Yellowstone St
- 556 Fawn Ct
- 788 Erie Ct
- 831 Renaissance Dr
- 555 Fawn Ct
- 604 Chestnut Dr