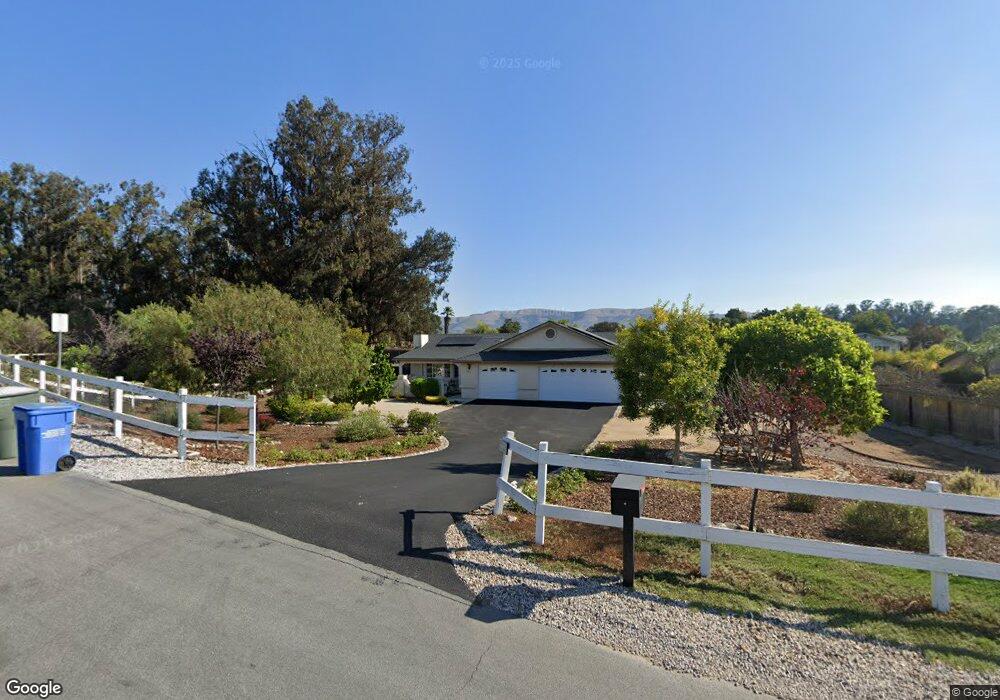
575 Meredith Ave Nipomo, CA 93444
Estimated Value: $806,000 - $982,000
4
Beds
2
Baths
1,820
Sq Ft
$494/Sq Ft
Est. Value
About This Home
This home is located at 575 Meredith Ave, Nipomo, CA 93444 and is currently estimated at $898,223, approximately $493 per square foot. 575 Meredith Ave is a home located in San Luis Obispo County with nearby schools including Dorothea Lange Elementary School, Mesa Middle School, and Nipomo High School.
Ownership History
Date
Name
Owned For
Owner Type
Purchase Details
Closed on
Aug 27, 2024
Sold by
Wilson Family Trust and Wilson Charles Orin
Bought by
Wilson Family Trust and Wilson
Current Estimated Value
Purchase Details
Closed on
Aug 18, 2021
Sold by
Gleis Andrew B and Andrew B Gleis Living Trust
Bought by
Wilson Charles Orin and Wilson Joanne Kristine
Purchase Details
Closed on
May 18, 2017
Sold by
Gleis Andrew B
Bought by
Gleis Andrew B
Purchase Details
Closed on
Mar 24, 2010
Sold by
Briar Rose Estates Llc
Bought by
Gleis Andrew B
Purchase Details
Closed on
Dec 18, 2008
Sold by
Newdoll Rosie Ogrady
Bought by
Newdoll Robert H
Purchase Details
Closed on
Dec 9, 2008
Sold by
Newdoll Robert H
Bought by
Briar Rose Estates Llc
Create a Home Valuation Report for This Property
The Home Valuation Report is an in-depth analysis detailing your home's value as well as a comparison with similar homes in the area
Home Values in the Area
Average Home Value in this Area
Purchase History
| Date | Buyer | Sale Price | Title Company |
|---|---|---|---|
| Wilson Family Trust | -- | None Listed On Document | |
| Wilson Charles Orin | $790,000 | First American Title Company | |
| Gleis Andrew B | -- | None Available | |
| Gleis Andrew B | $460,000 | Fidelity National Title Co | |
| Newdoll Robert H | -- | Accommodation | |
| Briar Rose Estates Llc | -- | Accommodation | |
| Newdoll Robert H | -- | Accommodation |
Source: Public Records
Tax History Compared to Growth
Tax History
| Year | Tax Paid | Tax Assessment Tax Assessment Total Assessment is a certain percentage of the fair market value that is determined by local assessors to be the total taxable value of land and additions on the property. | Land | Improvement |
|---|---|---|---|---|
| 2025 | $4,173 | $412,856 | $148,402 | $264,454 |
| 2024 | $8,524 | $404,762 | $145,493 | $259,269 |
| 2023 | $8,524 | $805,800 | $357,000 | $448,800 |
| 2022 | $8,396 | $790,000 | $350,000 | $440,000 |
| 2021 | $5,892 | $551,531 | $256,387 | $295,144 |
| 2020 | $5,824 | $545,877 | $253,759 | $292,118 |
| 2019 | $5,787 | $535,175 | $248,784 | $286,391 |
| 2018 | $5,716 | $524,682 | $243,906 | $280,776 |
| 2017 | $5,608 | $514,395 | $239,124 | $275,271 |
| 2016 | $5,287 | $504,310 | $234,436 | $269,874 |
| 2015 | $5,210 | $496,736 | $230,915 | $265,821 |
| 2014 | $5,016 | $487,006 | $226,392 | $260,614 |
Source: Public Records
Map
Nearby Homes
- 725 Monarch Ln
- 626 Juno Ct
- 483 Violet Ave
- 450 Avenida de Socios Unit 12
- 368 Avenida de Amigos
- 522 Higos Way
- 525 Grande Ave Unit D
- 424 Bermuda Place
- 840 Story St
- 232 Scarlett Cir
- Mesa Plan at Hill Street Terraces - Hill Street Series
- Pacific Plan at Hill Street Terraces - Hill Street Series
- Monarch Plan at Hill Street Terraces - Hill Street Series
- Rancho Plan at Hill Street Terraces - Hill Street Series
- Dana Plan at Hill Street Terraces - Hill Street Series
- 945 Jeanette Ln
- 680 Hill St
- 449 W Tefft St Unit 23
- 449 W Tefft St Unit 13
- 719 W Tefft St