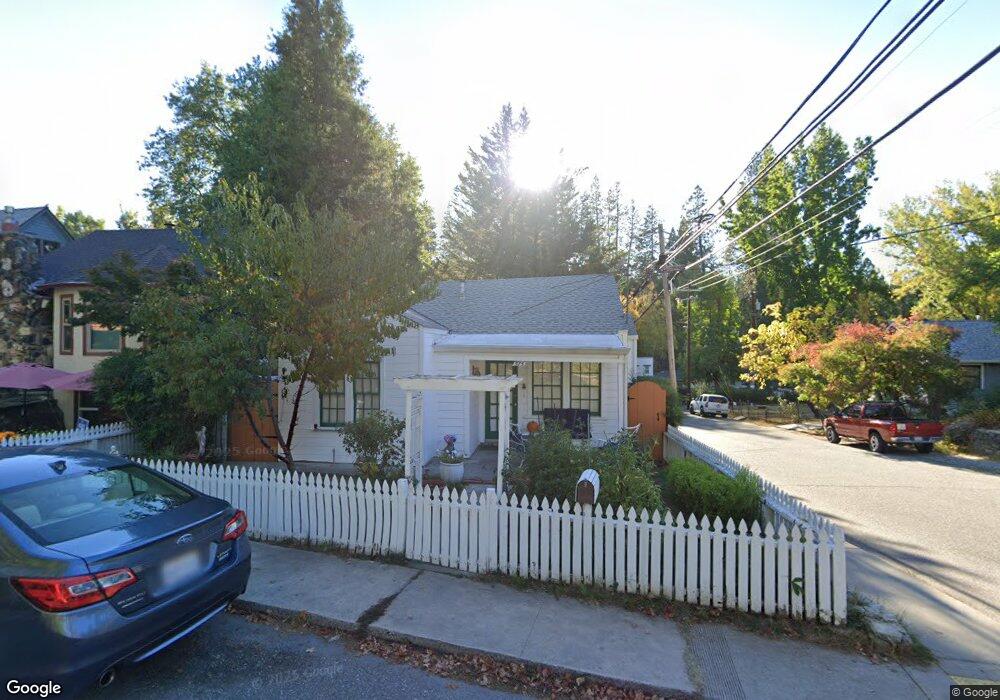
575 N Pine St Nevada City, CA 95959
Estimated Value: $396,998 - $565,000
2
Beds
1
Bath
803
Sq Ft
$612/Sq Ft
Est. Value
About This Home
This home is located at 575 N Pine St, Nevada City, CA 95959 and is currently estimated at $491,250, approximately $611 per square foot. 575 N Pine St is a home located in Nevada County with nearby schools including Deer Creek Elementary School, Seven Hills Intermediate School, and Forest Charter School.
Ownership History
Date
Name
Owned For
Owner Type
Purchase Details
Closed on
Nov 13, 2023
Sold by
Pranckitas William
Bought by
Karin And William Pranckitas Trust and Pranckitas
Current Estimated Value
Purchase Details
Closed on
Sep 15, 2003
Sold by
Pranckitas William and Pranckitas Karen E
Bought by
Pranckitas William
Home Financials for this Owner
Home Financials are based on the most recent Mortgage that was taken out on this home.
Original Mortgage
$20,000
Interest Rate
6.22%
Mortgage Type
Stand Alone Second
Create a Home Valuation Report for This Property
The Home Valuation Report is an in-depth analysis detailing your home's value as well as a comparison with similar homes in the area
Home Values in the Area
Average Home Value in this Area
Purchase History
| Date | Buyer | Sale Price | Title Company |
|---|---|---|---|
| Karin And William Pranckitas Trust | -- | None Listed On Document | |
| Pranckitas William | -- | Alliance Title Company |
Source: Public Records
Mortgage History
| Date | Status | Borrower | Loan Amount |
|---|---|---|---|
| Previous Owner | Pranckitas William | $20,000 |
Source: Public Records
Tax History Compared to Growth
Tax History
| Year | Tax Paid | Tax Assessment Tax Assessment Total Assessment is a certain percentage of the fair market value that is determined by local assessors to be the total taxable value of land and additions on the property. | Land | Improvement |
|---|---|---|---|---|
| 2025 | $2,175 | $211,860 | $141,261 | $70,599 |
| 2024 | $2,208 | $207,707 | $138,492 | $69,215 |
| 2023 | $2,208 | $203,635 | $135,777 | $67,858 |
| 2022 | $2,165 | $199,643 | $133,115 | $66,528 |
| 2021 | $2,102 | $195,729 | $130,505 | $65,224 |
| 2020 | $2,099 | $193,723 | $129,167 | $64,556 |
| 2019 | $2,058 | $189,926 | $126,635 | $63,291 |
| 2018 | $0 | $186,202 | $124,152 | $62,050 |
| 2017 | $1,982 | $182,554 | $121,719 | $60,835 |
| 2016 | $1,911 | $178,978 | $119,334 | $59,644 |
| 2015 | $1,885 | $176,292 | $117,542 | $58,750 |
| 2014 | -- | $172,842 | $115,241 | $57,601 |
Source: Public Records
Map
Nearby Homes
- 708 W Broad St
- 140 Redbud Way
- 500 Factory St
- 520 Lost Hill Ct
- 421 Broad St
- 214 Mill St
- 210 Mill St
- 327 Drummond St
- 660 Chief Kelly Dr
- 439 Washington St
- 651 Chief Kelly Dr
- 631 Chief Kelly Dr
- 134 Boulder St
- 157 Grove St
- 30115 N Bloomfield-Graniteville Rd
- 803 Uren St
- 251 Willow Valley Rd Unit 17
- 447 Zion St
- 347 Nile St
- 16970 Old Downieville Hwy