575 Pheasant Way Centerville, UT 84014
Estimated Value: $533,000 - $761,000
4
Beds
4
Baths
2,166
Sq Ft
$299/Sq Ft
Est. Value
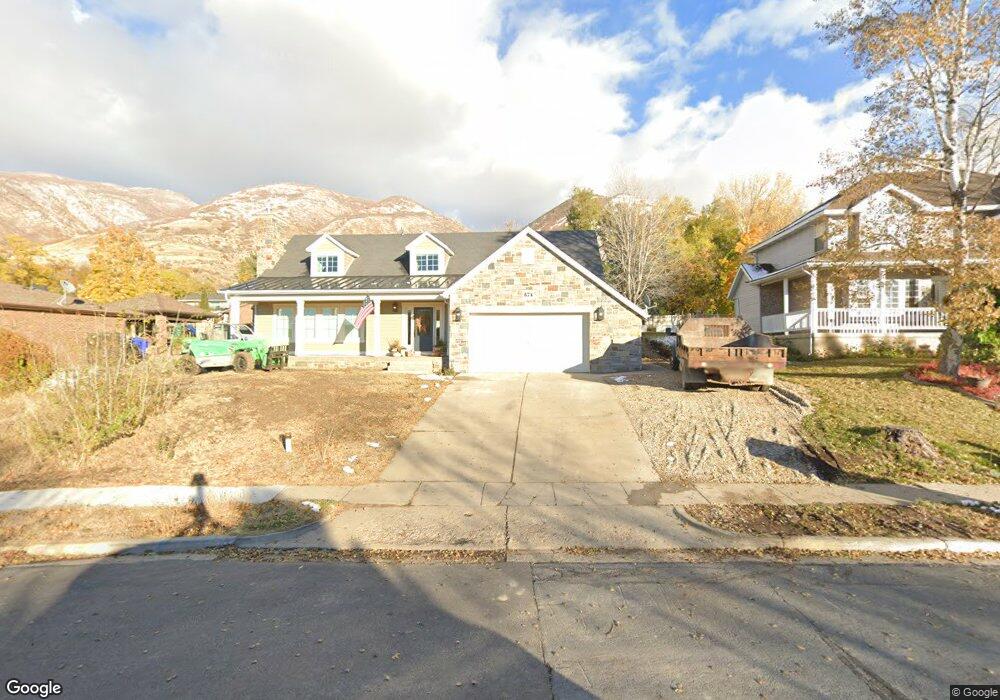
About This Home
This home is located at 575 Pheasant Way, Centerville, UT 84014 and is currently estimated at $646,601, approximately $298 per square foot. 575 Pheasant Way is a home located in Davis County with nearby schools including Centerville Elementary, Centerville Jr High, and Viewmont High School.
Ownership History
Date
Name
Owned For
Owner Type
Purchase Details
Closed on
Apr 16, 2021
Sold by
Wright Shannon P
Bought by
Wright Shannon P and Wright Terrie L
Current Estimated Value
Home Financials for this Owner
Home Financials are based on the most recent Mortgage that was taken out on this home.
Original Mortgage
$390,500
Outstanding Balance
$291,449
Interest Rate
3.05%
Mortgage Type
New Conventional
Estimated Equity
$355,152
Purchase Details
Closed on
Jan 31, 2020
Sold by
Moultrie Susan and Palmer Susan M
Bought by
Wright Shannon P
Home Financials for this Owner
Home Financials are based on the most recent Mortgage that was taken out on this home.
Original Mortgage
$430,000
Interest Rate
3.7%
Mortgage Type
New Conventional
Purchase Details
Closed on
Sep 20, 2019
Sold by
Palmer Garen W and Palmer Susan M
Bought by
Palmer Susan M
Create a Home Valuation Report for This Property
The Home Valuation Report is an in-depth analysis detailing your home's value as well as a comparison with similar homes in the area
Purchase History
| Date | Buyer | Sale Price | Title Company |
|---|---|---|---|
| Wright Shannon P | -- | Old Republic Natl Tit | |
| Wright Shannon P | -- | Old Republic Natl Titl | |
| Wright Shannon P | -- | North American Tit | |
| Palmer Susan M | -- | None Available |
Source: Public Records
Mortgage History
| Date | Status | Borrower | Loan Amount |
|---|---|---|---|
| Open | Wright Shannon P | $390,500 | |
| Closed | Wright Shannon P | $430,000 |
Source: Public Records
Tax History
| Year | Tax Paid | Tax Assessment Tax Assessment Total Assessment is a certain percentage of the fair market value that is determined by local assessors to be the total taxable value of land and additions on the property. | Land | Improvement |
|---|---|---|---|---|
| 2025 | $3,571 | $341,550 | $173,909 | $167,641 |
| 2024 | $3,381 | $328,899 | $158,932 | $169,967 |
| 2023 | $3,186 | $308,000 | $141,491 | $166,508 |
| 2022 | $3,380 | $595,000 | $237,455 | $357,545 |
| 2021 | $3,024 | $456,000 | $203,231 | $252,769 |
| 2020 | $2,972 | $448,000 | $196,541 | $251,459 |
| 2019 | $3,172 | $442,000 | $190,547 | $251,453 |
| 2018 | $2,880 | $403,000 | $176,461 | $226,539 |
| 2016 | $323 | $198,440 | $62,894 | $135,546 |
| 2015 | $2,427 | $185,075 | $62,894 | $122,181 |
| 2014 | $884 | $221,406 | $62,894 | $158,512 |
| 2013 | -- | $159,458 | $52,886 | $106,572 |
Source: Public Records
Map
Nearby Homes
- 563 N 220 E
- 243 Balsam Dr
- 380 E 400 N
- 984 N 500 E
- 252 N 400 E
- 66 Brookside Ln
- 1092 N 500 E
- 775 Pheasantbrook Cir
- 165 W Pheasantbrook Dr
- 56 W 200 N
- 360 E Center St
- 185 N 50 W
- 16 S 200 E
- 282 W 605 N Unit A
- 282 W 605 N Unit I
- 281 W 650 N Unit B
- 132 W 200 N
- 303 W 650 N Unit I
- 1290 Oakridge Dr
- 781 Pheasantbrook Dr
Your Personal Tour Guide
Ask me questions while you tour the home.