
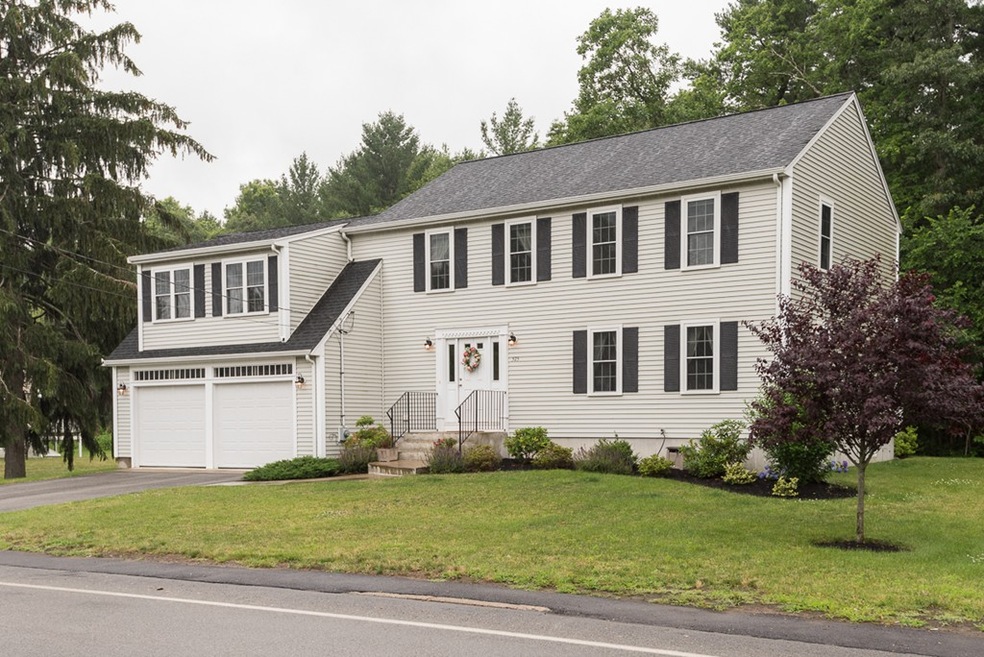
575 Salem St Rockland, MA 02370
4
Beds
3
Baths
2,514
Sq Ft
0.79
Acres
Highlights
- Deck
- Attic
- Forced Air Heating and Cooling System
- Wood Flooring
- Security Service
About This Home
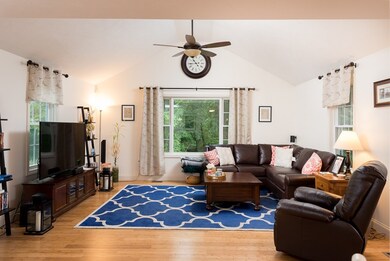
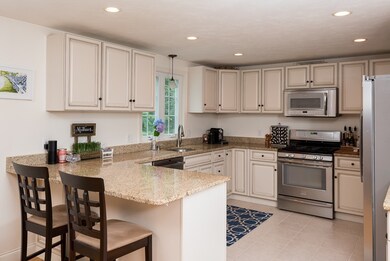
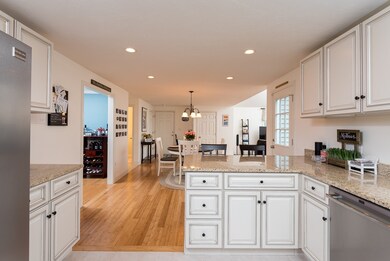
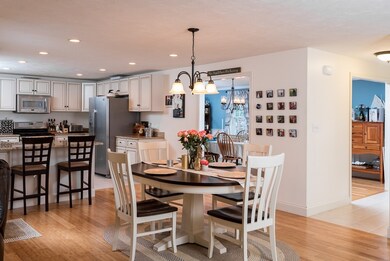
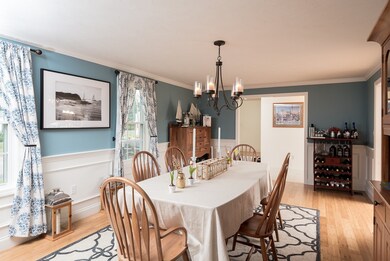
As of April 2018Move right in to this newer construction 4 bed, 2.5 bath colonial with a great open layout perfect for entertaining! This home offers tons of privacy and great outdoor space with a deck off the kitchen, large yard, and conservation land out back. The attractive high end kitchen opens up to a beautiful living room with soaring cathedral ceilings. A separate dining room with lovely wainscot paneling provides ample room for a large table- an ideal space for dinner parties! Upstairs features 4 bedrooms, including an over-sized master suite with cathedral ceilings, his and her closets, and a full en-suite bath. Three additional bedrooms, a second full bath, and laundry room round out the second level. This home features an unfinished walk-up attic as well as a full basement that is already studded out and ready to be finished. Great options for storage as well as the potential for additional living space! Central A/C, all newer systems, and a 2 car attached garage make this an easy choice!
Home Details
Home Type
- Single Family
Est. Annual Taxes
- $9,487
Year Built
- Built in 2010
Lot Details
- Year Round Access
- Sprinkler System
Parking
- 2 Car Garage
Kitchen
- Range
- Microwave
- Freezer
- Dishwasher
- Disposal
Flooring
- Wood
- Wall to Wall Carpet
- Tile
Outdoor Features
- Deck
Utilities
- Forced Air Heating and Cooling System
- Heating System Uses Gas
- Cable TV Available
Additional Features
- Attic
- Basement
Community Details
- Security Service
Listing and Financial Details
- Assessor Parcel Number M:37 B:0 L:7
Ownership History
Date
Name
Owned For
Owner Type
Purchase Details
Listed on
Feb 14, 2018
Closed on
Apr 26, 2018
Sold by
Mathews Patrick M and Mathews Sara E
Bought by
Russell Jeremy A and Russell Danielle J
Seller's Agent
Lauren Mahoney
Compass
Buyer's Agent
Hillary Corner
Berkshire Hathaway HomeServices Commonwealth Real Estate
List Price
$499,000
Sold Price
$500,000
Premium/Discount to List
$1,000
0.2%
Current Estimated Value
Home Financials for this Owner
Home Financials are based on the most recent Mortgage that was taken out on this home.
Estimated Appreciation
$279,752
Avg. Annual Appreciation
6.14%
Original Mortgage
$510,750
Interest Rate
4.44%
Mortgage Type
FHA
Purchase Details
Listed on
Nov 2, 2011
Closed on
Sep 5, 2013
Sold by
Roy V Nelson & Sons Inc
Bought by
Mathews Patrick M and Mathews Sara E
Seller's Agent
George Raymond
Raymond & Son REALTORS®
Buyer's Agent
George Raymond II
Raymond & Son REALTORS®
List Price
$399,900
Sold Price
$425,000
Premium/Discount to List
$25,100
6.28%
Home Financials for this Owner
Home Financials are based on the most recent Mortgage that was taken out on this home.
Avg. Annual Appreciation
3.56%
Original Mortgage
$340,000
Interest Rate
4.34%
Mortgage Type
New Conventional
Purchase Details
Closed on
Dec 30, 2008
Sold by
Turner Donald L and Cusick Paul L
Bought by
Roy V Nelson & Sons Inc
Similar Homes in Rockland, MA
Create a Home Valuation Report for This Property
The Home Valuation Report is an in-depth analysis detailing your home's value as well as a comparison with similar homes in the area
Home Values in the Area
Average Home Value in this Area
Purchase History
| Date | Type | Sale Price | Title Company |
|---|---|---|---|
| Not Resolvable | $500,000 | -- | |
| Not Resolvable | $425,000 | -- | |
| Not Resolvable | $425,000 | -- | |
| Deed | $230,000 | -- |
Source: Public Records
Mortgage History
| Date | Status | Loan Amount | Loan Type |
|---|---|---|---|
| Open | $499,585 | Stand Alone Refi Refinance Of Original Loan | |
| Closed | $510,750 | FHA | |
| Previous Owner | $340,000 | Stand Alone Refi Refinance Of Original Loan | |
| Previous Owner | $340,000 | New Conventional |
Source: Public Records
Property History
| Date | Event | Price | Change | Sq Ft Price |
|---|---|---|---|---|
| 04/26/2018 04/26/18 | Sold | $500,000 | +0.2% | $199 / Sq Ft |
| 02/25/2018 02/25/18 | Pending | -- | -- | -- |
| 02/14/2018 02/14/18 | For Sale | $499,000 | +17.4% | $198 / Sq Ft |
| 09/05/2013 09/05/13 | Sold | $425,000 | -1.2% | $187 / Sq Ft |
| 04/02/2013 04/02/13 | Pending | -- | -- | -- |
| 02/28/2013 02/28/13 | Price Changed | $430,000 | +7.5% | $189 / Sq Ft |
| 11/06/2012 11/06/12 | For Sale | $399,900 | -5.9% | $176 / Sq Ft |
| 10/31/2012 10/31/12 | Off Market | $425,000 | -- | -- |
| 08/04/2012 08/04/12 | For Sale | $399,900 | -5.9% | $176 / Sq Ft |
| 07/31/2012 07/31/12 | Off Market | $425,000 | -- | -- |
| 02/29/2012 02/29/12 | Price Changed | $399,900 | +5.3% | $176 / Sq Ft |
| 01/26/2012 01/26/12 | Price Changed | $379,900 | -2.6% | $167 / Sq Ft |
| 11/18/2011 11/18/11 | Price Changed | $390,000 | +5.4% | $171 / Sq Ft |
| 11/02/2011 11/02/11 | For Sale | $369,900 | -- | $163 / Sq Ft |
Source: MLS Property Information Network (MLS PIN)
Tax History Compared to Growth
Tax History
| Year | Tax Paid | Tax Assessment Tax Assessment Total Assessment is a certain percentage of the fair market value that is determined by local assessors to be the total taxable value of land and additions on the property. | Land | Improvement |
|---|---|---|---|---|
| 2025 | $9,487 | $694,000 | $230,700 | $463,300 |
| 2024 | $9,280 | $660,000 | $217,600 | $442,400 |
| 2023 | $9,452 | $621,000 | $210,100 | $410,900 |
| 2022 | $9,122 | $544,600 | $182,700 | $361,900 |
| 2021 | $8,640 | $500,000 | $166,100 | $333,900 |
| 2020 | $8,397 | $479,800 | $158,200 | $321,600 |
| 2019 | $8,258 | $460,800 | $150,700 | $310,100 |
| 2018 | $8,339 | $457,700 | $150,700 | $307,000 |
| 2017 | $8,006 | $433,200 | $150,700 | $282,500 |
| 2016 | $7,760 | $419,700 | $144,900 | $274,800 |
| 2015 | $7,384 | $388,000 | $135,400 | $252,600 |
| 2014 | $7,028 | $383,200 | $132,800 | $250,400 |
Source: Public Records
Agents Affiliated with this Home
-
Lauren Mahoney
L
Seller's Agent in 2018
Lauren Mahoney
Compass
(781) 400-0822
82 Total Sales
-
Hillary Corner
Buyer's Agent in 2018
Hillary Corner
Berkshire Hathaway HomeServices Commonwealth Real Estate
(508) 523-4563
114 Total Sales
-
George Raymond
Seller's Agent in 2013
George Raymond
Raymond & Son REALTORS®
(617) 799-1350
1 in this area
26 Total Sales
-
George Raymond II
Buyer's Agent in 2013
George Raymond II
Raymond & Son REALTORS®
(781) 962-1960
3 in this area
54 Total Sales
Map
Source: MLS Property Information Network (MLS PIN)
MLS Number: 72281445
APN: ROCK-000037-000000-000007
Disclaimer: Certain information contained herein is derived from information provided by parties other than Homes.com. All information provided is deemed reliable, but is not guaranteed to be accurate and should be independently verified.
![]() The property listing data and information, or the Images, set forth herein were provided to MLS Property Information Network, Inc. from third party sources, including sellers, lessors and public records, and were compiled by MLS Property Information Network, Inc. The property listing data and information, and the Images, are for the personal, non-commercial use of consumers having a good faith interest in purchasing or leasing listed properties of the type displayed to them and may not be used for any purpose other than to identify prospective properties which such consumers may have a good faith interest in purchasing or leasing. MLS Property Information Network, Inc. and its subscribers disclaim any and all representations and warranties as to the accuracy of the property listing data and information, or as to the accuracy of any of the Images, set forth herein.
The property listing data and information, or the Images, set forth herein were provided to MLS Property Information Network, Inc. from third party sources, including sellers, lessors and public records, and were compiled by MLS Property Information Network, Inc. The property listing data and information, and the Images, are for the personal, non-commercial use of consumers having a good faith interest in purchasing or leasing listed properties of the type displayed to them and may not be used for any purpose other than to identify prospective properties which such consumers may have a good faith interest in purchasing or leasing. MLS Property Information Network, Inc. and its subscribers disclaim any and all representations and warranties as to the accuracy of the property listing data and information, or as to the accuracy of any of the Images, set forth herein.
Nearby Homes
- 586 Salem St
- 22 Howland Way
- 5 Florence St
- 40 Florence St
- 33 Birch St Unit 126
- 5 Forsythia Ln
- 40 Fir Rd Unit 386
- 27 Fir Rd
- 23 Harriet Rd
- 131 Spruce St
- 48 Leisurewoods Dr
- 57 Battery St
- 125 Reed St
- 114-116 Pacific St
- 79 Leisurewoods Dr Unit 315
- 135 Grove St Unit 136
- 135 Grove St Unit 145
- 135 Grove St Unit 120
- 96 Plymouth St
- 5 Juniper Cir Unit 312