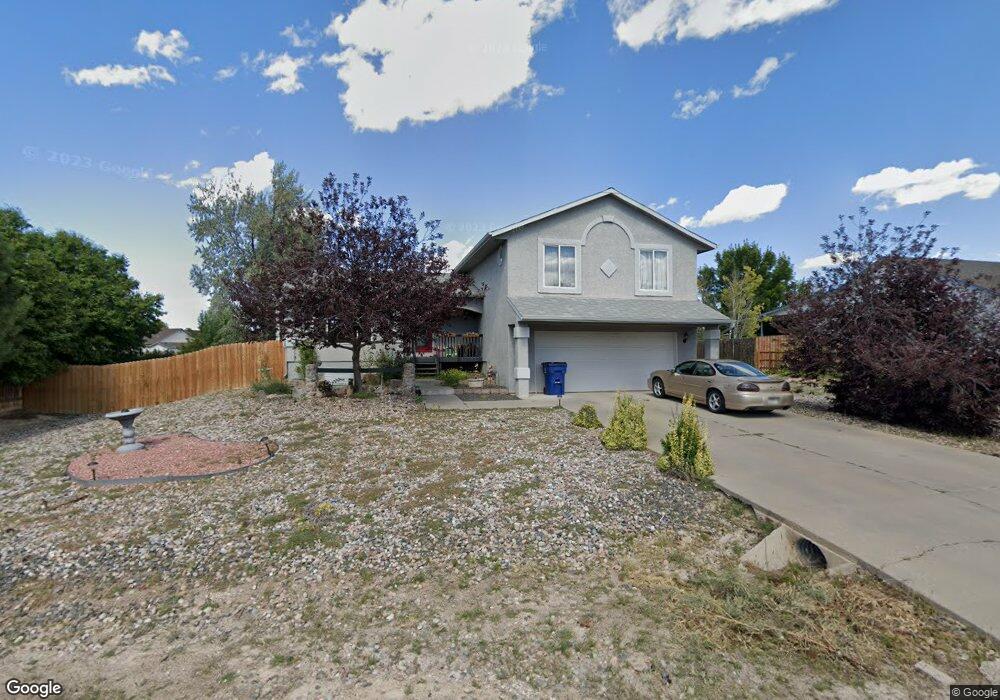
575 W Slice Dr Pueblo, CO 81007
Estimated Value: $406,000 - $434,000
3
Beds
2
Baths
2,744
Sq Ft
$151/Sq Ft
Est. Value
About This Home
This home is located at 575 W Slice Dr, Pueblo, CO 81007 and is currently estimated at $415,302, approximately $151 per square foot. 575 W Slice Dr is a home located in Pueblo County with nearby schools including Sierra Vista Elementary School, Sky View Middle School, and Pueblo West High School.
Ownership History
Date
Name
Owned For
Owner Type
Purchase Details
Closed on
Dec 6, 2002
Sold by
Yarbrough Richard + Richard D
Bought by
Yarbrough Richard
Current Estimated Value
Purchase Details
Closed on
Oct 8, 2002
Sold by
Yarbrough Richard D + Crystal
Bought by
Yarbrough Richard + Richard D
Purchase Details
Closed on
Jul 8, 1999
Sold by
Land Marketing Company
Bought by
Yarbrough Richard D + Crystal
Purchase Details
Closed on
Nov 19, 1998
Sold by
Real Estate Exchange Ltd
Bought by
Land Marketing Company
Purchase Details
Closed on
Nov 18, 1998
Sold by
Real Estate Exchange Ltd
Bought by
Real Estate Exchange Ltd
Purchase Details
Closed on
Nov 9, 1998
Sold by
Carew Harriet Lee
Bought by
W G K Inc
Purchase Details
Closed on
Oct 28, 1998
Sold by
W G K Inc
Bought by
Real Estate Exchange Ltd
Purchase Details
Closed on
Jan 4, 1982
Sold by
Lawyers Title Of Pueblo Tr
Bought by
Carew Harriet Lee
Create a Home Valuation Report for This Property
The Home Valuation Report is an in-depth analysis detailing your home's value as well as a comparison with similar homes in the area
Home Values in the Area
Average Home Value in this Area
Purchase History
| Date | Buyer | Sale Price | Title Company |
|---|---|---|---|
| Yarbrough Richard | -- | -- | |
| Yarbrough Richard + Richard D | -- | -- | |
| Yarbrough Richard D + Crystal | $150,000 | -- | |
| Land Marketing Company | $7,500 | -- | |
| Real Estate Exchange Ltd | -- | -- | |
| W G K Inc | $3,200 | -- | |
| Real Estate Exchange Ltd | -- | -- | |
| Carew Harriet Lee | -- | -- |
Source: Public Records
Tax History Compared to Growth
Tax History
| Year | Tax Paid | Tax Assessment Tax Assessment Total Assessment is a certain percentage of the fair market value that is determined by local assessors to be the total taxable value of land and additions on the property. | Land | Improvement |
|---|---|---|---|---|
| 2024 | $2,339 | $23,310 | -- | -- |
| 2023 | $2,366 | $26,990 | $2,410 | $24,580 |
| 2022 | $2,130 | $21,225 | $2,780 | $18,445 |
| 2021 | $2,184 | $21,840 | $2,860 | $18,980 |
| 2020 | $1,750 | $21,840 | $2,860 | $18,980 |
| 2019 | $1,745 | $17,456 | $715 | $16,741 |
| 2018 | $1,532 | $15,321 | $720 | $14,601 |
| 2017 | $1,534 | $15,321 | $720 | $14,601 |
| 2016 | $1,454 | $14,551 | $1,433 | $13,118 |
| 2015 | $1,442 | $14,551 | $1,433 | $13,118 |
| 2014 | $1,366 | $13,769 | $1,433 | $12,336 |
Source: Public Records
Map
Nearby Homes
- 534 W Hook Dr
- 533 W Archer Dr
- 425 S Fairway Dr
- 496 W Mangrum Dr
- 456 S Hahns Peak Ave
- 473 W Archer Dr
- 476 S Hahns Peak Ave
- 528 W Golfwood Dr
- 523 W Hook Dr
- 489 S Pin High Dr
- 256 S Spaulding Ave
- 444 W Archer Dr
- 250 S Spaulding Ave
- 225 S Spaulding Ave
- 244 S Spaulding Ave
- TBD Spaulding Ave
- 438 W Fairway Dr
- 433 W Fairway Dr
- 337 S Littler Dr E
- 450 W Pin High Dr
- 567 W Slice Dr
- 583 W Slice Dr
- 455 S Archer Dr
- 459 S Archer Dr
- 559 W Slice Dr
- 574 W Slice Dr
- 472 S Hook Ct
- 591 W Slice Dr
- 451 S Archer Dr
- 582 W Slice Dr
- 566 W Slice Dr
- 566 W Slice Dr Unit 4
- 508 S Hook Dr
- 508 S Hook Dr Unit 1
- 463 S Archer Dr
- 558 W Slice Dr
- 558 W Slice Dr Unit 5
- 551 W Slice Dr
- 551 W Slice Dr Unit 12
- 447 S Archer Dr