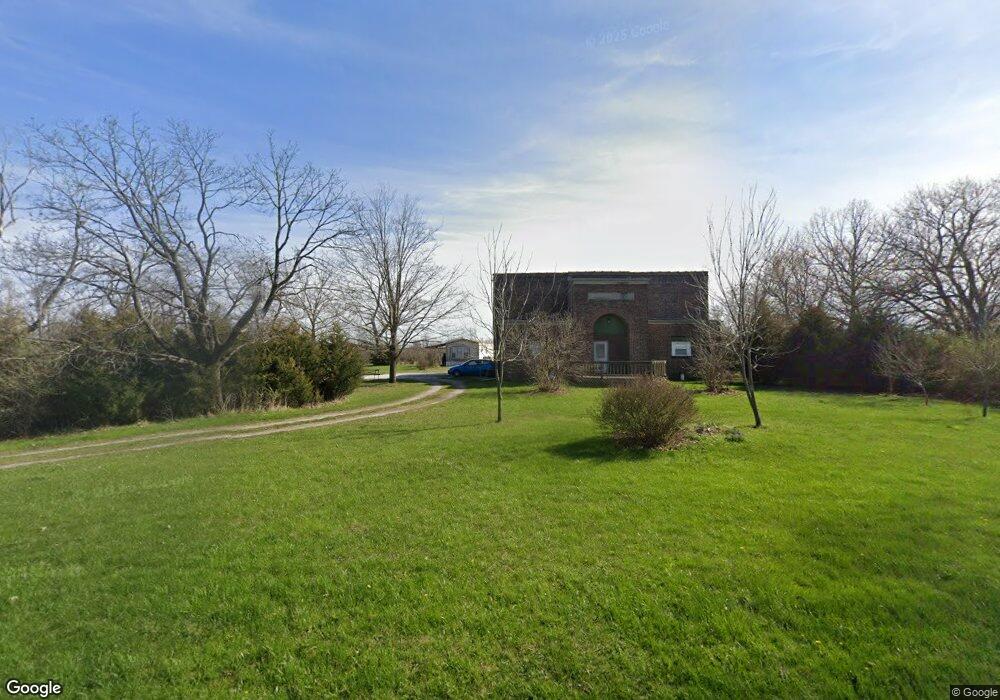
5754 E 400 N van Buren, IN 46991
Estimated Value: $244,000 - $308,000
4
Beds
4
Baths
3,938
Sq Ft
$69/Sq Ft
Est. Value
About This Home
This home is located at 5754 E 400 N, van Buren, IN 46991 and is currently estimated at $272,020, approximately $69 per square foot. 5754 E 400 N is a home.
Ownership History
Date
Name
Owned For
Owner Type
Purchase Details
Closed on
Nov 2, 2012
Sold by
Millerfirst Federal Savings Bank
Bought by
Miller Daniel S
Current Estimated Value
Home Financials for this Owner
Home Financials are based on the most recent Mortgage that was taken out on this home.
Original Mortgage
$32,000
Outstanding Balance
$4,603
Interest Rate
3.32%
Mortgage Type
New Conventional
Estimated Equity
$267,417
Purchase Details
Closed on
Mar 23, 2006
Sold by
Fifth Third Bank
Bought by
Witkamp Gregory D and Witkamp Eva P
Create a Home Valuation Report for This Property
The Home Valuation Report is an in-depth analysis detailing your home's value as well as a comparison with similar homes in the area
Purchase History
| Date | Buyer | Sale Price | Title Company |
|---|---|---|---|
| Miller Daniel S | -- | None Available | |
| Witkamp Gregory D | -- | None Available |
Source: Public Records
Mortgage History
| Date | Status | Borrower | Loan Amount |
|---|---|---|---|
| Open | Miller Daniel S | $32,000 |
Source: Public Records
Tax History
| Year | Tax Paid | Tax Assessment Tax Assessment Total Assessment is a certain percentage of the fair market value that is determined by local assessors to be the total taxable value of land and additions on the property. | Land | Improvement |
|---|---|---|---|---|
| 2024 | $1,629 | $212,100 | $36,800 | $175,300 |
| 2023 | $1,432 | $200,900 | $36,800 | $164,100 |
| 2022 | $1,464 | $185,800 | $32,700 | $153,100 |
| 2021 | $1,431 | $161,800 | $32,700 | $129,100 |
| 2020 | $1,265 | $155,700 | $32,700 | $123,000 |
| 2019 | $1,130 | $145,700 | $32,700 | $113,000 |
| 2018 | $1,021 | $136,800 | $32,700 | $104,100 |
| 2017 | $926 | $128,900 | $32,700 | $96,200 |
| 2016 | $761 | $128,900 | $32,700 | $96,200 |
| 2014 | $746 | $138,200 | $32,700 | $105,500 |
| 2013 | $746 | $138,100 | $32,700 | $105,400 |
Source: Public Records
Map
Nearby Homes
- 4015 N 600 E
- 2804 N 800 E
- 603 W Main St
- 8885 E 400 N
- 106 N Washington St
- 201 E Vine St
- 9964 E 400 N
- 933 E Bocock Rd
- I 69 E 700 N
- 619 S 600 E
- 3105 N Huntington Rd
- 1700 E Bradford Pike
- 2325 N Huntington Rd
- 8219 E 100 S
- 2220 N Huntington Rd
- 703 E Bond Ave
- 214 N Vickery Ln
- 1113 E Grant St
- 528 E Wiley St
- 1270 S 600 E
Your Personal Tour Guide
Ask me questions while you tour the home.