NOT LISTED FOR SALE

Estimated Value: $101,000 - $150,130

2 Beds
1 Bath
1,728 Sq Ft
$76/Sq Ft Est. Value

Last Sold July 30, 2021

Last sale price $80,000 $46 Per Sq Ft

Est. 64% increase in value since last sale

Current estimated payment $871/month

About This Home

As of July 2021

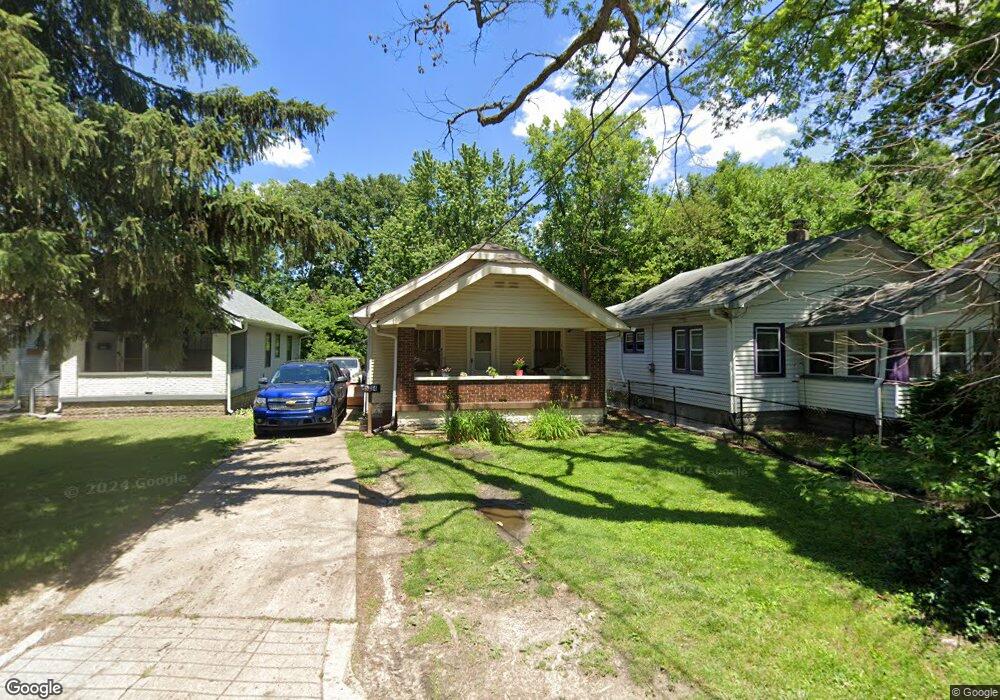
Beautiful 2 bed 1 bath home in Irvington. Welcoming front porch and large back deck ideal for gatherings. Investors welcome as the home already has tenants in place on a month to month lease.

Ownership History

Date Name Owned For Owner Type

Purchase Details

Listed on
Jun 2, 2021
Closed on
Jul 30, 2021
Sold by
Ion Home Solutions Inc
Bought by
Hlgf Investments Llc
Seller's Agent
Daniel Smith
White Stag Realty, LLC
Buyer's Agent
Daniel Smith
White Stag Realty, LLC
Sold Price
$80,000
Current Estimated Value
$131,533

Home Financials for this Owner

Home Financials are based on the most recent Mortgage that was taken out on this home.
Estimated Appreciation
$51,533
Avg. Annual Appreciation
12.66%

Purchase Details

Listed on
Jun 2, 2021
Closed on
Jul 29, 2021
Sold by
Ion Home Solutions Inc
Bought by
Hlgf Investments Llc
Seller's Agent
Daniel Smith
White Stag Realty, LLC
Buyer's Agent
Daniel Smith
White Stag Realty, LLC
Sold Price
$80,000

Purchase Details

Closed on
Feb 5, 2015
Sold by
Simcox Rabon and Simcox Helen
Bought by
Ion Home Solutions Inc
Source: Public Records

Range of Values:

Collateral Analytics

Collateral Analytics Collateral Analytics AVMs (Automated Valuation Model) employ a number of statistical approaches combined with neighborhood-specific comparable selection guarantees the most up-to-date and precise valuations.

Not Available

Collateral Analytics does not have data for the current month. Please view the chart for historical values.

ICE

ICE Mortgage Technology ICE Mortgage Technology’s AVM (Automated Valuation Model) is a state-of-the-art online residential property valuation tool that provides a quick and accurate estimate of the value of almost any home in the U.S.

Not Available

ICE Mortgage Technology does not have data for the current month. Please view the chart for historical values.

First American

First American First American Data & Analytics’ next-generation AVM combines unrivaled data assets with a blended ensemble of valuation models to produce highly accurate, reliable valuations you can trust.

Not Available

First American does not have data for the current month. Please view the chart for historical values.

Quantarium

Quantarium Quantarium’s valuation service, repeatedly proven the industry’s most accurate and comprehensive, is supercharged with a self-learning and auto-tuning AI engine that continually becomes smarter and more accurate as it processes daily inputs from the industry’s leading RE data lake.

Not Available

Quantarium does not have data for the current month. Please view the chart for historical values.

Average Value
Not Available
List Price
Sold Price
Create a Home Valuation Report for This Property
The Home Valuation Report is an in-depth analysis detailing your home's value as well as a comparison with similar homes in the area

Home Values in the Area

Source: Public Records

Average Home Value in this Area


Source: Public Records

Purchase History

Date Buyer Sale Price Title Company
Hlgf Investments Llc -- New Title Company Name
Hlgf Investments Llc $80,000 None Available
Ion Home Solutions Inc -- Chicago Title Company Llc
Source: Public Records

Property History

Date Event Price List to Sale Price per Sq Ft Prior Sale
07/30/2021 07/30/21 Sold $80,000 -27.2% $46 / Sq Ft View Prior Sale
07/18/2021 07/18/21 Pending -- -- --
07/01/2021 07/01/21 For Sale -- -- --
06/24/2021 06/24/21 Pending -- -- --
06/02/2021 06/02/21 For Sale $109,900 -- $64 / Sq Ft

Tax History Compared to Growth

Source: Public Records

Tax History

Year Tax Paid Tax Assessment Tax Assessment Total Assessment is a certain percentage of the fair market value that is determined by local assessors to be the total taxable value of land and additions on the property. Land Improvement
2024 $2,057 $89,900 $20,700 $69,200
2023 $2,057 $83,000 $20,700 $62,300
2022 $2,114 $85,900 $20,700 $65,200
2021 $2,770 $116,400 $20,700 $95,700
2020 $2,362 $98,300 $13,700 $84,600
2019 $2,274 $92,800 $13,700 $79,100
2018 $2,191 $88,500 $13,700 $74,800
2017 $1,844 $83,100 $13,700 $69,400
2016 $1,599 $73,200 $13,700 $59,500
2014 $1,431 $66,000 $13,700 $52,300
2013 $1,335 $64,000 $13,700 $50,300
Source: Public Records

Agents Affiliated with this Home

  • Section Image
See All Agents

Map