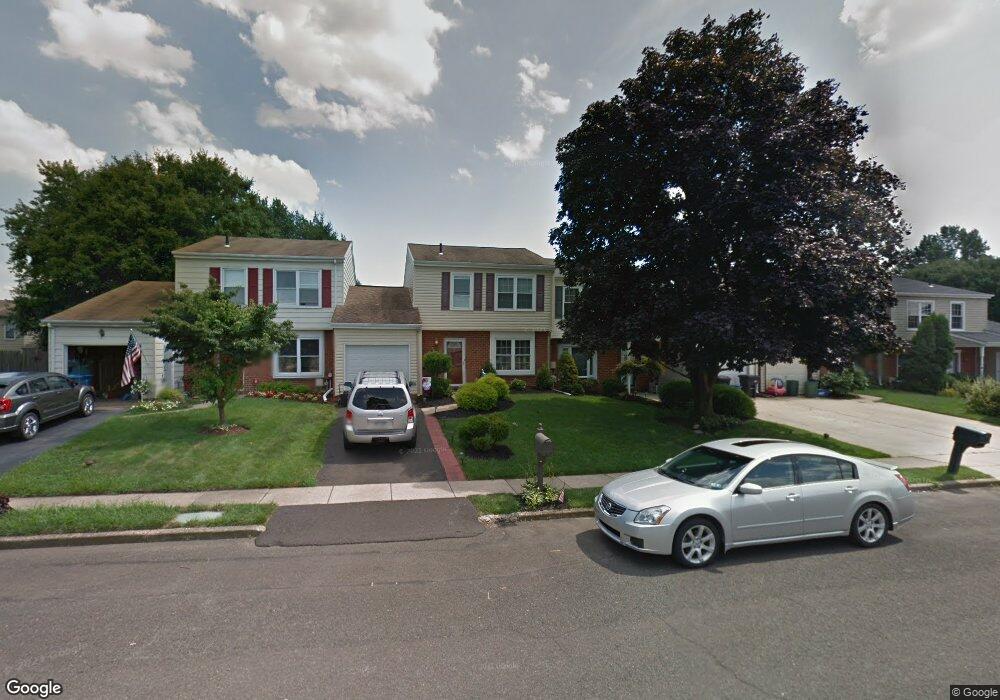
5755 Randall Ct Bensalem, PA 19020
Neshaminy Valley NeighborhoodEstimated Value: $365,851 - $398,000
3
Beds
2
Baths
1,513
Sq Ft
$254/Sq Ft
Est. Value
About This Home
This home is located at 5755 Randall Ct, Bensalem, PA 19020 and is currently estimated at $384,213, approximately $253 per square foot. 5755 Randall Ct is a home located in Bucks County with nearby schools including Valley Elementary School, St. Ephrem School, and Bensalem Baptist School.
Ownership History
Date
Name
Owned For
Owner Type
Purchase Details
Closed on
Jan 12, 2007
Sold by
Mancini Michael George and Mancini Gina Maria
Bought by
Stanley Christine M and Moretti Michael E
Current Estimated Value
Home Financials for this Owner
Home Financials are based on the most recent Mortgage that was taken out on this home.
Original Mortgage
$251,009
Outstanding Balance
$149,501
Interest Rate
6.15%
Mortgage Type
FHA
Estimated Equity
$234,712
Purchase Details
Closed on
Jan 17, 2006
Sold by
Mancini Michael and Mancini Gina Maria
Bought by
Mancini Michael George and Mancini Gina Maria
Purchase Details
Closed on
Oct 30, 1998
Sold by
Lacey John J and Allen Paul D
Bought by
Mueller Wolfram R and Mueller Susan M
Home Financials for this Owner
Home Financials are based on the most recent Mortgage that was taken out on this home.
Original Mortgage
$91,800
Interest Rate
6.49%
Create a Home Valuation Report for This Property
The Home Valuation Report is an in-depth analysis detailing your home's value as well as a comparison with similar homes in the area
Home Values in the Area
Average Home Value in this Area
Purchase History
| Date | Buyer | Sale Price | Title Company |
|---|---|---|---|
| Stanley Christine M | $253,000 | None Available | |
| Mancini Michael George | -- | None Available | |
| Mueller Wolfram R | $102,000 | -- |
Source: Public Records
Mortgage History
| Date | Status | Borrower | Loan Amount |
|---|---|---|---|
| Open | Stanley Christine M | $251,009 | |
| Previous Owner | Mueller Wolfram R | $91,800 |
Source: Public Records
Tax History Compared to Growth
Tax History
| Year | Tax Paid | Tax Assessment Tax Assessment Total Assessment is a certain percentage of the fair market value that is determined by local assessors to be the total taxable value of land and additions on the property. | Land | Improvement |
|---|---|---|---|---|
| 2025 | $4,541 | $20,800 | $2,520 | $18,280 |
| 2024 | $4,541 | $20,800 | $2,520 | $18,280 |
| 2023 | $4,412 | $20,800 | $2,520 | $18,280 |
| 2022 | $4,387 | $20,800 | $2,520 | $18,280 |
| 2021 | $4,387 | $20,800 | $2,520 | $18,280 |
| 2020 | $4,343 | $20,800 | $2,520 | $18,280 |
| 2019 | $4,246 | $20,800 | $2,520 | $18,280 |
| 2018 | $4,147 | $20,800 | $2,520 | $18,280 |
| 2017 | $4,121 | $20,800 | $2,520 | $18,280 |
| 2016 | $4,121 | $20,800 | $2,520 | $18,280 |
| 2015 | -- | $20,800 | $2,520 | $18,280 |
| 2014 | -- | $20,800 | $2,520 | $18,280 |
Source: Public Records
Map
Nearby Homes
- 5762 Prescott Ct
- 3255 Independence Ct
- 6257 Nathan Hale Ct
- 2493 Barnsleigh Dr
- 3200 Ellington Ct
- 6501 Saratoga Turn
- 4525 Winding Brook Dr Unit 4525
- 6369 Powder Horn Ct
- 3162 Sheppard Rd
- 4902 Oxford Ct
- 4828 Oxford Ct
- 5813 Edge Ave
- 1838 Sheri Rd
- 6561 Neshaminy Valley Dr
- 223 Saddlebrook Dr
- 225 Saddlebrook Dr
- 3021 Claridge Rd
- 927 Bellevue Ave
- 120 Liberty Dr Unit 120
- 5178 Neshaminy Blvd
- 5753 Randall Ct
- 5751 Randall Ct
- 5749 Randall Ct
- 5757 Randall Ct
- 5752 Prescott Ct
- 5754 Prescott Ct
- 5750 Prescott Ct
- 5748 Prescott Ct
- 5758 Prescott Ct
- 5760 Prescott Ct
- 5764 Randall Ct
- 5762 Randall Ct
- 5764 Prescott Ct
- 5760 Randall Ct
- 5750 Randall Ct
- 5752 Randall Ct
- 5748 Randall Ct
- 5738 Shetland Ct
- 5754 Randall Ct
- 5756 Randall Ct