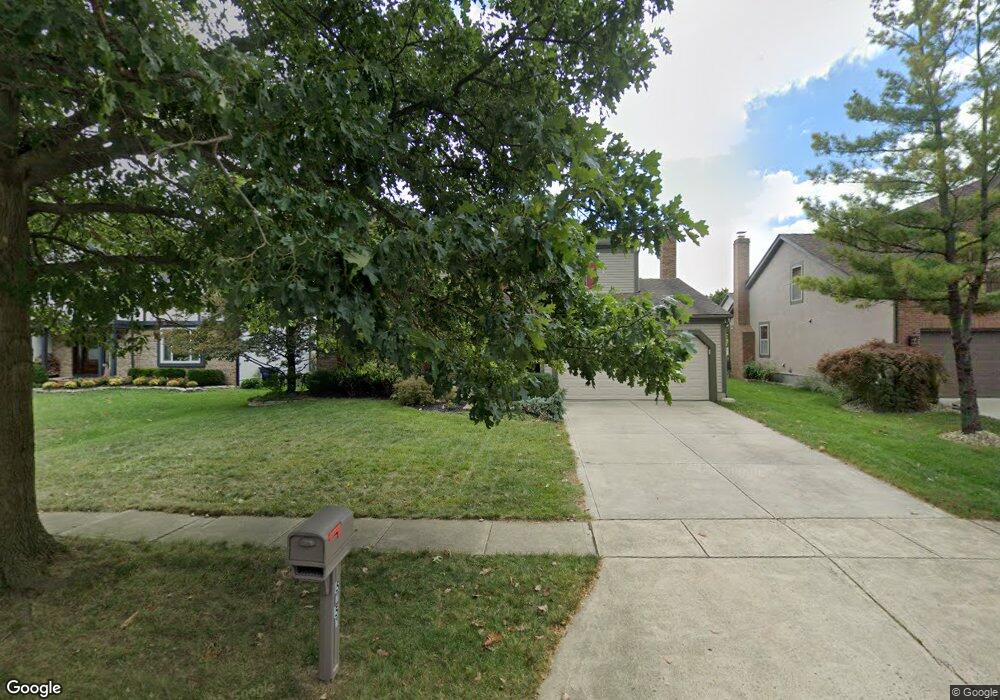
5757 Whispering Oak Blvd Hilliard, OH 43026
Cross Creek NeighborhoodEstimated Value: $434,000 - $465,000
4
Beds
3
Baths
2,186
Sq Ft
$203/Sq Ft
Est. Value
About This Home
This home is located at 5757 Whispering Oak Blvd, Hilliard, OH 43026 and is currently estimated at $443,396, approximately $202 per square foot. 5757 Whispering Oak Blvd is a home located in Franklin County with nearby schools including Scioto Darby Elementary School, Hilliard Station Sixth Grade Elementary School, and Hilliard Heritage Middle School.
Ownership History
Date
Name
Owned For
Owner Type
Purchase Details
Closed on
Dec 19, 2019
Sold by
Shrider Dale R and Shrider Patricia E
Bought by
Shrider Dale Robert and Shrider Patricia Eileen
Current Estimated Value
Purchase Details
Closed on
Jun 9, 2000
Sold by
Inman Wayne H and Inman Nancy M
Bought by
Shrider Dale R and Shrider Patricia R
Home Financials for this Owner
Home Financials are based on the most recent Mortgage that was taken out on this home.
Original Mortgage
$100,000
Outstanding Balance
$35,480
Interest Rate
8.31%
Estimated Equity
$407,916
Purchase Details
Closed on
Sep 3, 1996
Sold by
Mcnamara Joseph M
Bought by
Inman Wayne H and Inman Nancy M
Home Financials for this Owner
Home Financials are based on the most recent Mortgage that was taken out on this home.
Original Mortgage
$149,000
Outstanding Balance
$12,908
Interest Rate
8.3%
Mortgage Type
New Conventional
Estimated Equity
$430,488
Purchase Details
Closed on
Jan 21, 1992
Create a Home Valuation Report for This Property
The Home Valuation Report is an in-depth analysis detailing your home's value as well as a comparison with similar homes in the area
Home Values in the Area
Average Home Value in this Area
Purchase History
| Date | Buyer | Sale Price | Title Company |
|---|---|---|---|
| Shrider Dale Robert | -- | None Available | |
| Shrider Dale R | $182,900 | Chicago Title | |
| Inman Wayne H | $156,900 | -- | |
| -- | $127,300 | -- |
Source: Public Records
Mortgage History
| Date | Status | Borrower | Loan Amount |
|---|---|---|---|
| Open | Shrider Dale R | $100,000 | |
| Open | Inman Wayne H | $149,000 |
Source: Public Records
Tax History Compared to Growth
Tax History
| Year | Tax Paid | Tax Assessment Tax Assessment Total Assessment is a certain percentage of the fair market value that is determined by local assessors to be the total taxable value of land and additions on the property. | Land | Improvement |
|---|---|---|---|---|
| 2024 | $8,353 | $124,710 | $33,810 | $90,900 |
| 2023 | $6,802 | $124,705 | $33,810 | $90,895 |
| 2022 | $6,386 | $93,180 | $15,370 | $77,810 |
| 2021 | $6,382 | $93,180 | $15,370 | $77,810 |
| 2020 | $6,366 | $93,180 | $15,370 | $77,810 |
| 2019 | $6,013 | $74,910 | $12,290 | $62,620 |
| 2018 | $5,812 | $74,910 | $12,290 | $62,620 |
| 2017 | $5,977 | $74,910 | $12,290 | $62,620 |
| 2016 | $5,963 | $69,030 | $13,340 | $55,690 |
| 2015 | $5,632 | $69,030 | $13,340 | $55,690 |
| 2014 | $5,642 | $69,030 | $13,340 | $55,690 |
| 2013 | $2,726 | $65,730 | $12,705 | $53,025 |
Source: Public Records
Map
Nearby Homes
- 5743 Turner Ln
- 2658 Rolling Oaks Blvd
- 2654 Brittany Oaks Blvd
- 2650 Brittany Oaks Blvd
- 2592 Cowall Dr
- 5606 Oldwynne Rd
- 2735 Quailview Ln
- 5570 Oldwynne Rd
- 2755 Rustling Oak Blvd
- 2880 Wynneleaf St
- 5488 Whispering Oak Blvd
- 2625 Rustling Oak Blvd
- 2643 Westrock Dr
- 6056 Glade Run Rd
- 5459 Red Wynne Ln
- 2491 Pressman Dr
- 6132 Brushwood Blvd
- 2603 Westrock Dr
- 2817 Westrock Dr
- 5851 Dena Dr
- 5749 Whispering Oak Blvd
- 5769 Whispering Oak Blvd
- 2683 Westwind Ct
- 5777 Whispering Oak Blvd
- 2687 Westwind Ct
- 5741 Whispering Oak Blvd
- 2679 Westwind Ct
- 5758 Whispering Oak Blvd
- 2693 Westwind Ct
- 5750 Whispering Oak Blvd
- 5766 Whispering Oak Blvd
- 5787 Whispering Oak Blvd
- 5742 Whispering Oak Blvd
- 5776 Whispering Oak Blvd
- 2675 Westwind Ct
- 5732 Whispering Oak Blvd
- 5784 Whispering Oak Blvd
- 5749 Turner Ln
- 2684 Westwind Ct
- 2734 Westwind Ct