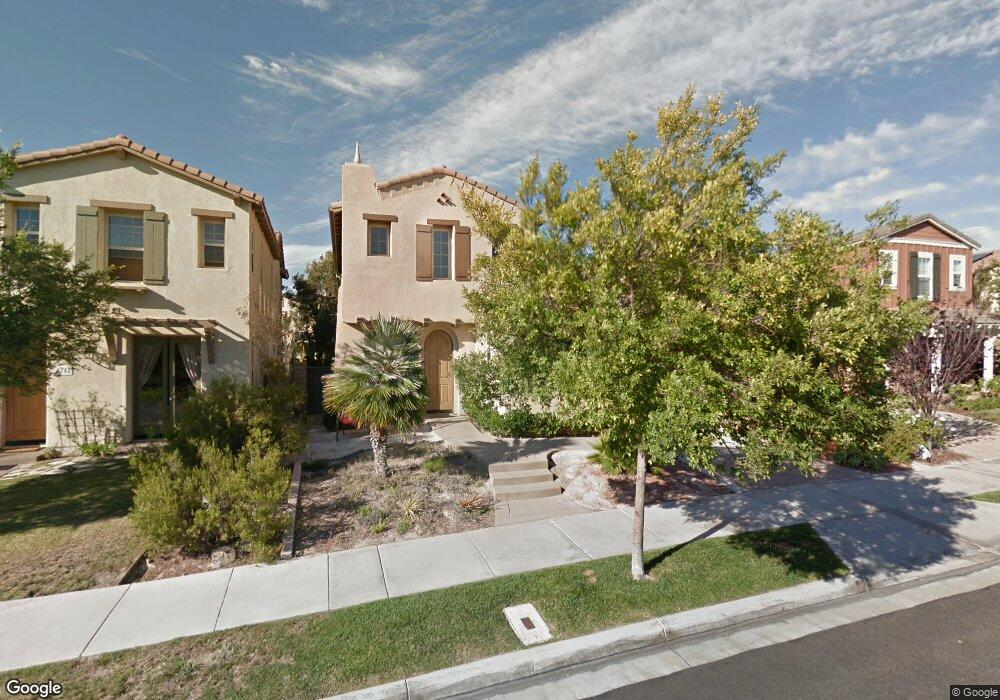
5758 Cornflower Trail San Diego, CA 92130
Carmel Valley NeighborhoodEstimated Value: $1,911,125 - $2,042,000
3
Beds
3
Baths
2,097
Sq Ft
$936/Sq Ft
Est. Value
About This Home
This home is located at 5758 Cornflower Trail, San Diego, CA 92130 and is currently estimated at $1,962,281, approximately $935 per square foot. 5758 Cornflower Trail is a home located in San Diego County with nearby schools including Solana Ranch Elementary School, Pacific Trails Middle, and Torrey Pines High School.
Ownership History
Date
Name
Owned For
Owner Type
Purchase Details
Closed on
Jun 24, 2008
Sold by
Lacaze Scott G and La Caze Michael L
Bought by
Weir Robert S and Weir Nanci L
Current Estimated Value
Home Financials for this Owner
Home Financials are based on the most recent Mortgage that was taken out on this home.
Original Mortgage
$648,800
Outstanding Balance
$421,831
Interest Rate
6.31%
Mortgage Type
Unknown
Estimated Equity
$1,540,450
Purchase Details
Closed on
Nov 30, 2005
Sold by
Lacaze Nancy G
Bought by
Lacaze Michael L
Home Financials for this Owner
Home Financials are based on the most recent Mortgage that was taken out on this home.
Original Mortgage
$450,000
Interest Rate
5.37%
Mortgage Type
Unknown
Purchase Details
Closed on
Oct 25, 2005
Sold by
Pardee Homes
Bought by
Lacaze Scott G and La Caze Michael L
Home Financials for this Owner
Home Financials are based on the most recent Mortgage that was taken out on this home.
Original Mortgage
$450,000
Interest Rate
5.37%
Mortgage Type
Unknown
Create a Home Valuation Report for This Property
The Home Valuation Report is an in-depth analysis detailing your home's value as well as a comparison with similar homes in the area
Home Values in the Area
Average Home Value in this Area
Purchase History
| Date | Buyer | Sale Price | Title Company |
|---|---|---|---|
| Weir Robert S | $811,000 | United Title Co S D Title | |
| Lacaze Michael L | -- | First American Title Company | |
| Lacaze Scott G | $807,500 | First American Title |
Source: Public Records
Mortgage History
| Date | Status | Borrower | Loan Amount |
|---|---|---|---|
| Open | Weir Robert S | $648,800 | |
| Previous Owner | Lacaze Scott G | $450,000 |
Source: Public Records
Tax History Compared to Growth
Tax History
| Year | Tax Paid | Tax Assessment Tax Assessment Total Assessment is a certain percentage of the fair market value that is determined by local assessors to be the total taxable value of land and additions on the property. | Land | Improvement |
|---|---|---|---|---|
| 2025 | $13,989 | $1,044,330 | $502,206 | $542,124 |
| 2024 | $13,989 | $1,023,854 | $492,359 | $531,495 |
| 2023 | $13,744 | $1,003,779 | $482,705 | $521,074 |
| 2022 | $13,560 | $984,098 | $473,241 | $510,857 |
| 2021 | $13,362 | $964,803 | $463,962 | $500,841 |
| 2020 | $13,267 | $954,911 | $459,205 | $495,706 |
| 2019 | $13,064 | $936,188 | $450,201 | $485,987 |
| 2018 | $12,869 | $917,832 | $441,374 | $476,458 |
| 2017 | $12,719 | $899,836 | $432,720 | $467,116 |
| 2016 | $12,078 | $850,000 | $435,000 | $415,000 |
| 2015 | $11,836 | $825,000 | $423,000 | $402,000 |
| 2014 | $11,595 | $800,000 | $411,000 | $389,000 |
Source: Public Records
Map
Nearby Homes
- 13016 Lumen Way
- 5621 Shasta Daisy Trail
- 12932 Peppergrass Creek Gate Unit 58
- 5582 Valerio Trail
- 13120 Chambord Way
- 13033 Lamia Point Unit 217
- 13032 Alora Point Unit 170
- 6265 Silverbush Creek St
- 5480 Valerio Trail
- 6222 Artisan Way
- 13348 Camelia Way
- 13233 Petunia Way
- 5312 Sweetwater Trail
- 5347 Morning Sage Way
- 13165 Caminito Mendiola
- 13441 Banyan Way
- 13563 Chamise Vista Ln
- 6336 Sagebrush Bend Way
- 13568 Bolero Way
- 14004 Calle Venecia
- 5764 Cornflower Trail
- 5752 Cornflower Trail
- 5746 Cornflower Trail
- 5770 Cornflower Trail
- 13525 Candy Tuft Path
- 13522 Candy Tuft Path
- 13531 Candy Tuft Path
- 13528 Candy Tuft Path
- 5740 Cornflower Trail
- 5757 Cornflower Trail
- 5763 Cornflower Trail
- 5751 Cornflower Trail
- 5838 Cape Jewels Trail
- 5844 Cape Jewels Trail
- 5769 Cornflower Trail
- 13501 Moonflower Meadows Trail
- 5850 Cape Jewels Trail
- 5745 Cornflower Trail
- 13509 Moonflower Meadows Trail
- 5734 Cornflower Trail