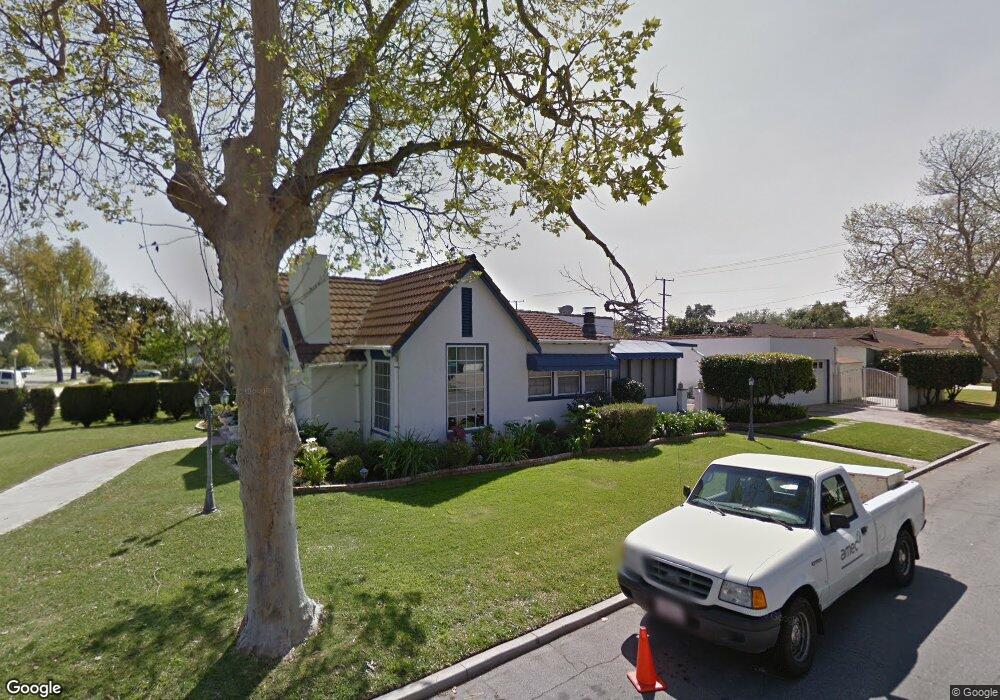
5759 Cloverly Ave Temple City, CA 91780
Estimated Value: $1,173,316 - $1,276,000
2
Beds
1
Bath
1,722
Sq Ft
$708/Sq Ft
Est. Value
About This Home
This home is located at 5759 Cloverly Ave, Temple City, CA 91780 and is currently estimated at $1,219,829, approximately $708 per square foot. 5759 Cloverly Ave is a home located in Los Angeles County with nearby schools including La Rosa Elementary, Oak Avenue Intermediate School, and Temple City High School.
Ownership History
Date
Name
Owned For
Owner Type
Purchase Details
Closed on
Jan 20, 2016
Sold by
Liu Jack
Bought by
Zhang Annie Xiaohua
Current Estimated Value
Purchase Details
Closed on
Jan 15, 2015
Sold by
Zhang Suhua
Bought by
Liu Jack and Zhang Annie Xiaohua
Purchase Details
Closed on
Sep 17, 2010
Sold by
Rose Robert E and Rose Susan S
Bought by
Liu Jack and Zhang Annie Xiaohua
Home Financials for this Owner
Home Financials are based on the most recent Mortgage that was taken out on this home.
Original Mortgage
$250,000
Interest Rate
4.35%
Mortgage Type
New Conventional
Purchase Details
Closed on
Aug 9, 2005
Sold by
Rose Susan S
Bought by
Rose Robert E
Home Financials for this Owner
Home Financials are based on the most recent Mortgage that was taken out on this home.
Original Mortgage
$345,600
Interest Rate
5.48%
Mortgage Type
New Conventional
Create a Home Valuation Report for This Property
The Home Valuation Report is an in-depth analysis detailing your home's value as well as a comparison with similar homes in the area
Home Values in the Area
Average Home Value in this Area
Purchase History
| Date | Buyer | Sale Price | Title Company |
|---|---|---|---|
| Zhang Annie Xiaohua | -- | None Available | |
| Liu Jack | $200,000 | None Available | |
| Liu Jack | $580,000 | Ticor Title Company | |
| Rose Robert E | -- | -- | |
| Rose Susan S | -- | United Title Company-La |
Source: Public Records
Mortgage History
| Date | Status | Borrower | Loan Amount |
|---|---|---|---|
| Previous Owner | Liu Jack | $250,000 | |
| Previous Owner | Rose Susan S | $345,600 |
Source: Public Records
Tax History Compared to Growth
Tax History
| Year | Tax Paid | Tax Assessment Tax Assessment Total Assessment is a certain percentage of the fair market value that is determined by local assessors to be the total taxable value of land and additions on the property. | Land | Improvement |
|---|---|---|---|---|
| 2025 | $8,820 | $746,955 | $557,897 | $189,058 |
| 2024 | $8,820 | $732,309 | $546,958 | $185,351 |
| 2023 | $8,619 | $717,951 | $536,234 | $181,717 |
| 2022 | $8,031 | $703,874 | $525,720 | $178,154 |
| 2021 | $8,177 | $690,073 | $515,412 | $174,661 |
| 2019 | $7,881 | $669,608 | $500,126 | $169,482 |
| 2018 | $7,697 | $656,479 | $490,320 | $166,159 |
| 2016 | $7,373 | $630,988 | $471,281 | $159,707 |
| 2015 | $7,266 | $618,280 | $476,289 | $141,991 |
| 2014 | -- | $606,170 | $466,960 | $139,210 |
Source: Public Records
Map
Nearby Homes
- 9459 Workman Ave
- 5929 Oak Ave
- 5530 Alessandro Ave
- 9720 Live Oak Ave
- 6119 Temple City Blvd
- 0 Sultana Ave
- 9409 Olive St
- 5619 Sultana Ave Unit A
- 6204 Oak Ave
- 9711 Garibaldi Ave
- 6159 Camellia Ave
- 5329 Alessandro Ave
- 5463 Sultana Ave
- 5819 Baldwin Ave Unit C
- 9538 Pentland St
- 6156 Rosemead Blvd Unit B
- 9665 Longden Ave
- 6137 Rosemead Blvd
- 6227 Sultana Ave
- 6159 Rosemead Blvd
- 5755 Cloverly Ave
- 9462 Workman Ave
- 5751 Cloverly Ave
- 9463 Workman Ave
- 5743 Cloverly Ave
- 9458 Workman Ave
- 5809 Cloverly Ave Unit B
- 5809 Cloverly Ave
- 5802 Cloverly Ave
- 5758 Cloverly Ave
- 5754 Cloverly Ave
- 5741 Cloverly Ave
- 5813 Cloverly Ave Unit B
- 5813 Cloverly Ave
- 5750 Cloverly Ave
- 9511 Workman Ave
- 5750 Oak Ave
- 5760 Oak Ave
- 5735 Cloverly Ave
- 5754 Oak Ave