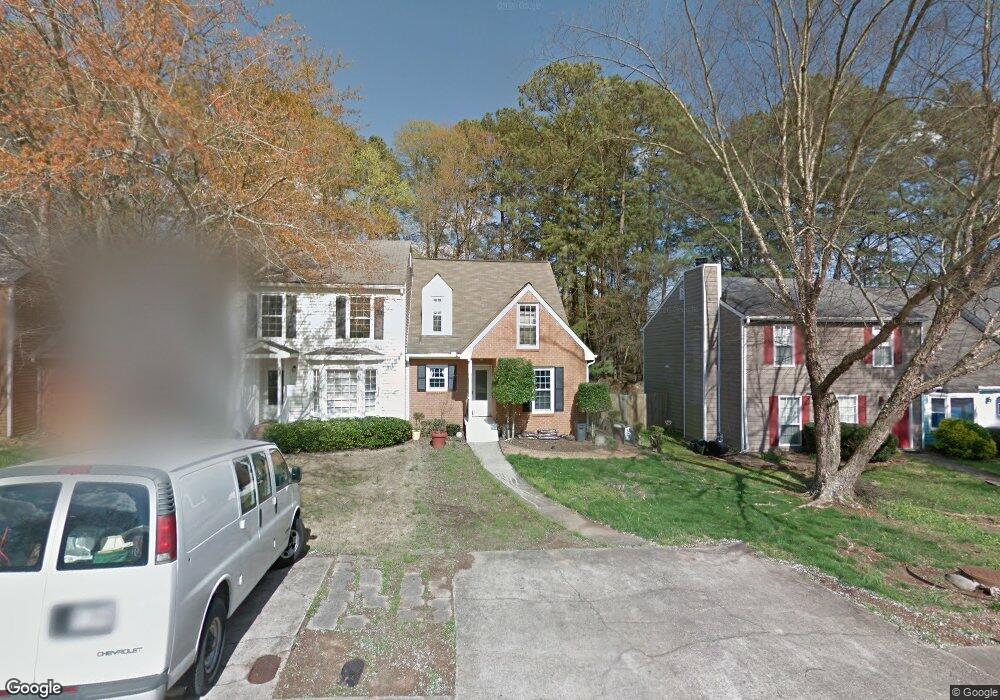
576 Manning Rd SW Marietta, GA 30064
Southwestern Marietta NeighborhoodEstimated Value: $285,000 - $318,000
3
Beds
3
Baths
1,458
Sq Ft
$209/Sq Ft
Est. Value
About This Home
This home is located at 576 Manning Rd SW, Marietta, GA 30064 and is currently estimated at $304,294, approximately $208 per square foot. 576 Manning Rd SW is a home located in Cobb County with nearby schools including A.L. Burruss Elementary School, Marietta Sixth Grade Academy, and Marietta Middle School.
Ownership History
Date
Name
Owned For
Owner Type
Purchase Details
Closed on
Oct 10, 2008
Sold by
Federal Home Loan Mortgage Corporation
Bought by
Harney Alanna M
Current Estimated Value
Home Financials for this Owner
Home Financials are based on the most recent Mortgage that was taken out on this home.
Original Mortgage
$58,800
Outstanding Balance
$37,698
Interest Rate
5.78%
Mortgage Type
New Conventional
Estimated Equity
$266,596
Purchase Details
Closed on
Jul 1, 2008
Sold by
Wells Fargo Bk Na
Bought by
Federal Home Loan Mortgage Corporation
Purchase Details
Closed on
Mar 30, 2001
Sold by
Knighten L S and Knighten Sandra K
Bought by
Mcgrath Nancy
Home Financials for this Owner
Home Financials are based on the most recent Mortgage that was taken out on this home.
Original Mortgage
$95,060
Interest Rate
7.11%
Mortgage Type
New Conventional
Purchase Details
Closed on
Oct 8, 1996
Sold by
Willey David B Pamela
Bought by
Knighten L Steven Sandra
Create a Home Valuation Report for This Property
The Home Valuation Report is an in-depth analysis detailing your home's value as well as a comparison with similar homes in the area
Home Values in the Area
Average Home Value in this Area
Purchase History
| Date | Buyer | Sale Price | Title Company |
|---|---|---|---|
| Harney Alanna M | $73,500 | -- | |
| Federal Home Loan Mortgage Corporation | -- | -- | |
| Wells Fargo Bk Na | $98,843 | -- | |
| Mcgrath Nancy | $98,000 | -- | |
| Knighten L Steven Sandra | $68,000 | -- |
Source: Public Records
Mortgage History
| Date | Status | Borrower | Loan Amount |
|---|---|---|---|
| Open | Harney Alanna M | $58,800 | |
| Previous Owner | Mcgrath Nancy | $95,060 |
Source: Public Records
Tax History Compared to Growth
Tax History
| Year | Tax Paid | Tax Assessment Tax Assessment Total Assessment is a certain percentage of the fair market value that is determined by local assessors to be the total taxable value of land and additions on the property. | Land | Improvement |
|---|---|---|---|---|
| 2025 | $993 | $117,396 | $34,000 | $83,396 |
| 2024 | $993 | $117,396 | $34,000 | $83,396 |
| 2023 | $993 | $117,396 | $34,000 | $83,396 |
| 2022 | $732 | $86,476 | $18,000 | $68,476 |
| 2021 | $483 | $56,180 | $18,000 | $38,180 |
| 2020 | $483 | $56,180 | $18,000 | $38,180 |
| 2019 | $438 | $51,020 | $16,000 | $35,020 |
| 2018 | $438 | $51,020 | $16,000 | $35,020 |
| 2017 | $235 | $34,144 | $8,000 | $26,144 |
| 2016 | $125 | $27,868 | $4,000 | $23,868 |
| 2015 | $138 | $27,868 | $4,000 | $23,868 |
| 2014 | $60 | $17,156 | $0 | $0 |
Source: Public Records
Map
Nearby Homes
- 560 Manning Rd SW
- 594 Manning Rd SW
- 199 Hickory Walk SW
- 207 Westland Cir SW
- 181 Brighton Ct SW
- 920 Westland Dr SW
- 332 Rockmann Ln SW
- 106 Westland Ct SW
- 1161 Rockmann Terrace SW
- 1141 Whitlock Ave NW
- 260 Manning Rd SW Unit 110
- 839 Manning Villas Ct SW
- 834 Cannon Run SW
- 1047 Chestnut Hill Cir SW
- 838 Cannon Run SW
- 1211 Cliffpine Ct SW
- 873 Cavalry Dr SW
- 798 Sentinel Ridge SW
- 576 Manning Rd SW
- 578 Manning Rd SW
- 578 Manning Rd SW
- 574 Manning Rd SW
- 580 Manning Rd SW
- 572 Manning Rd SW
- 582 Manning Rd SW
- 570 Manning Rd SW
- 570 Manning Rd SW
- 568 Manning Rd SW
- 584 Manning Rd SW Unit 1
- 586 Manning Rd SW
- 566 Manning Rd SW
- 588 Manning Rd SW Unit 1
- 165 Kimberly Way SW Unit 167
- 564 Manning Rd SW Unit 564
- 564 Manning Rd SW Unit 1/2
- 564 Manning Rd SW
- 161 Kimberly Way SW
- 590 Manning Rd SW