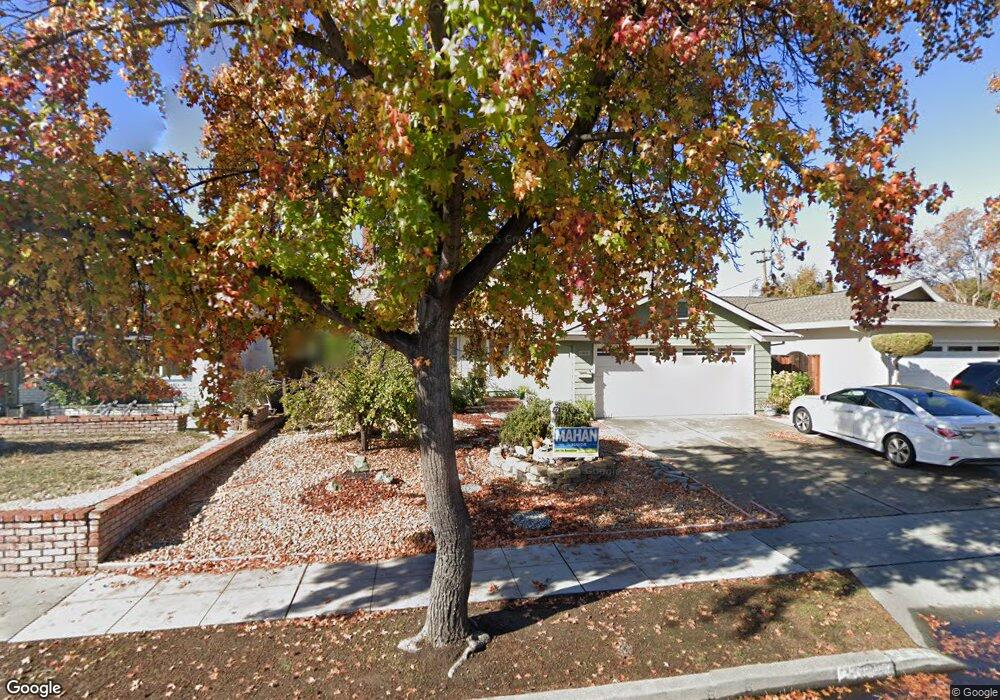
5763 Calpine Dr San Jose, CA 95123
Anderson East NeighborhoodEstimated Value: $1,243,000 - $1,345,000
3
Beds
2
Baths
1,617
Sq Ft
$801/Sq Ft
Est. Value
About This Home
This home is located at 5763 Calpine Dr, San Jose, CA 95123 and is currently estimated at $1,295,662, approximately $801 per square foot. 5763 Calpine Dr is a home located in Santa Clara County with nearby schools including Alex Anderson Elementary School, Bernal Intermediate School, and Oak Grove High School.
Ownership History
Date
Name
Owned For
Owner Type
Purchase Details
Closed on
Jun 13, 2012
Sold by
Lipari Steven G
Bought by
Lipari Steven Gerard
Current Estimated Value
Home Financials for this Owner
Home Financials are based on the most recent Mortgage that was taken out on this home.
Original Mortgage
$149,500
Interest Rate
3.77%
Mortgage Type
New Conventional
Purchase Details
Closed on
Oct 28, 2009
Sold by
Lipari Steven G and Lipari Lieu T
Bought by
Lipari Steven G
Home Financials for this Owner
Home Financials are based on the most recent Mortgage that was taken out on this home.
Original Mortgage
$192,338
Interest Rate
5.02%
Mortgage Type
New Conventional
Purchase Details
Closed on
Oct 11, 2001
Sold by
Dionne Rita J
Bought by
Lipari Steven G
Home Financials for this Owner
Home Financials are based on the most recent Mortgage that was taken out on this home.
Original Mortgage
$243,000
Interest Rate
6.88%
Create a Home Valuation Report for This Property
The Home Valuation Report is an in-depth analysis detailing your home's value as well as a comparison with similar homes in the area
Home Values in the Area
Average Home Value in this Area
Purchase History
| Date | Buyer | Sale Price | Title Company |
|---|---|---|---|
| Lipari Steven Gerard | -- | Stewart Title Of California | |
| Lipari Steven G | -- | North American Title Company | |
| Lipari Steven G | $427,500 | Chicago Title Co |
Source: Public Records
Mortgage History
| Date | Status | Borrower | Loan Amount |
|---|---|---|---|
| Closed | Lipari Steven Gerard | $149,500 | |
| Closed | Lipari Steven G | $192,338 | |
| Closed | Lipari Steven G | $243,000 | |
| Closed | Lipari Steven G | $40,000 |
Source: Public Records
Tax History
| Year | Tax Paid | Tax Assessment Tax Assessment Total Assessment is a certain percentage of the fair market value that is determined by local assessors to be the total taxable value of land and additions on the property. | Land | Improvement |
|---|---|---|---|---|
| 2025 | $9,156 | $631,155 | $283,927 | $347,228 |
| 2024 | $9,156 | $618,780 | $278,360 | $340,420 |
| 2023 | $9,001 | $606,648 | $272,902 | $333,746 |
| 2022 | $8,945 | $594,753 | $267,551 | $327,202 |
| 2021 | $8,796 | $583,092 | $262,305 | $320,787 |
| 2020 | $8,591 | $577,114 | $259,616 | $317,498 |
| 2019 | $8,386 | $565,799 | $254,526 | $311,273 |
| 2018 | $8,321 | $554,706 | $249,536 | $305,170 |
| 2017 | $8,207 | $543,831 | $244,644 | $299,187 |
| 2016 | $7,809 | $533,169 | $239,848 | $293,321 |
| 2015 | $7,631 | $525,162 | $236,246 | $288,916 |
| 2014 | $6,939 | $514,876 | $231,619 | $283,257 |
Source: Public Records
Map
Nearby Homes
- 211 Beegum Way
- 244 Beegum Way
- 5663 Beswick Dr
- 183 Benbow Ave
- 195 Blossom Hill Rd Unit 161
- 195 Blossom Hill Rd Unit 290
- 195 Blossom Hill Rd Unit 156
- 195 Blossom Hill Rd Unit 276
- 0 Deer Valley Rd Unit 225017975
- 5482 Makati Cir
- 5536 Makati Cir
- 5696 Makati Cir Unit G
- 165 Blossom Hill Rd Unit 145
- 5382 Makati Cir
- 5274 Makati Cir
- 5693 Makati Cir Unit D
- 165 Blossom Hill #268 Rd Unit 268
- 5705 Makati Cir Unit F
- 134 Herlong Ave
- 192 Sand Blossom St
Your Personal Tour Guide
Ask me questions while you tour the home.