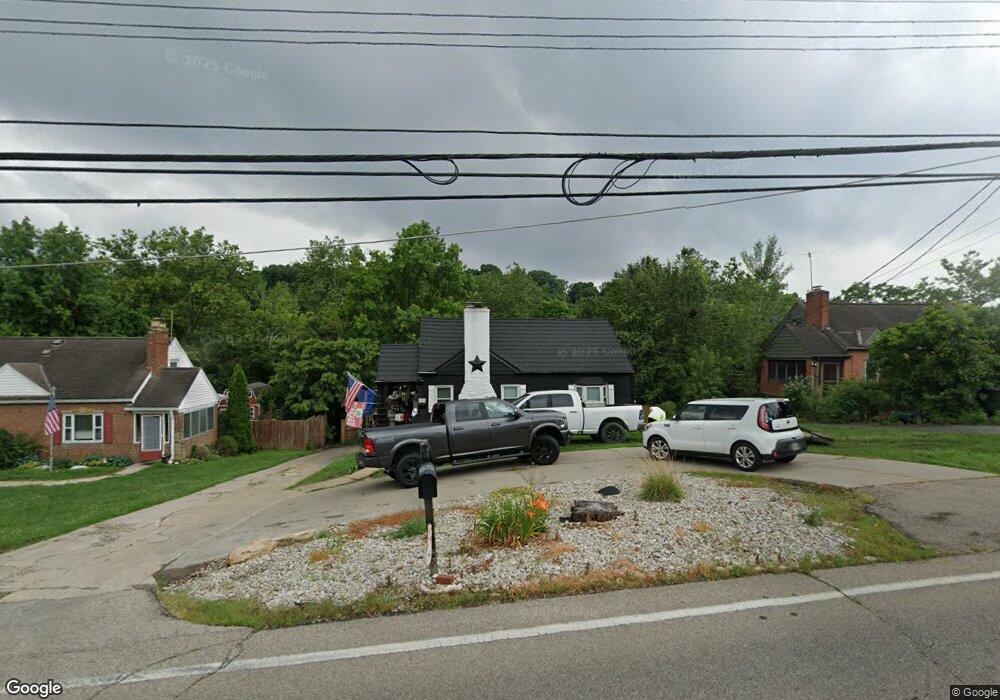
5763 E Kemper Rd Cincinnati, OH 45241
Estimated Value: $260,000 - $304,000
4
Beds
2
Baths
1,665
Sq Ft
$172/Sq Ft
Est. Value
About This Home
This home is located at 5763 E Kemper Rd, Cincinnati, OH 45241 and is currently estimated at $286,007, approximately $171 per square foot. 5763 E Kemper Rd is a home located in Hamilton County with nearby schools including Sharonville Elementary School, Princeton Community Middle School, and Princeton High School.
Ownership History
Date
Name
Owned For
Owner Type
Purchase Details
Closed on
Feb 16, 2002
Sold by
Randy Scott
Bought by
Scott Randy and Scott Raquel
Current Estimated Value
Home Financials for this Owner
Home Financials are based on the most recent Mortgage that was taken out on this home.
Original Mortgage
$120,000
Outstanding Balance
$47,075
Interest Rate
6.92%
Estimated Equity
$238,932
Purchase Details
Closed on
Aug 24, 2000
Sold by
Sue Graham Karla and Tankersley Stephen L
Bought by
Scott Randy
Home Financials for this Owner
Home Financials are based on the most recent Mortgage that was taken out on this home.
Original Mortgage
$111,800
Interest Rate
8.15%
Purchase Details
Closed on
Dec 13, 1994
Sold by
Manny Margie C and Ingram Margie C
Bought by
Graham Karla Sue and Tankersley Stephen L
Home Financials for this Owner
Home Financials are based on the most recent Mortgage that was taken out on this home.
Original Mortgage
$72,000
Interest Rate
9.06%
Create a Home Valuation Report for This Property
The Home Valuation Report is an in-depth analysis detailing your home's value as well as a comparison with similar homes in the area
Home Values in the Area
Average Home Value in this Area
Purchase History
| Date | Buyer | Sale Price | Title Company |
|---|---|---|---|
| Scott Randy | -- | Cardinal First Title Inc | |
| Scott Randy | $115,300 | Main Title Agency Inc | |
| Graham Karla Sue | -- | -- |
Source: Public Records
Mortgage History
| Date | Status | Borrower | Loan Amount |
|---|---|---|---|
| Open | Scott Randy | $120,000 | |
| Closed | Scott Randy | $111,800 | |
| Previous Owner | Graham Karla Sue | $72,000 | |
| Closed | Scott Randy | $30,000 |
Source: Public Records
Tax History
| Year | Tax Paid | Tax Assessment Tax Assessment Total Assessment is a certain percentage of the fair market value that is determined by local assessors to be the total taxable value of land and additions on the property. | Land | Improvement |
|---|---|---|---|---|
| 2025 | $3,128 | $65,643 | $11,358 | $54,285 |
| 2024 | $2,671 | $65,643 | $11,358 | $54,285 |
| 2023 | $2,757 | $65,643 | $11,358 | $54,285 |
| 2022 | $2,152 | $42,420 | $7,959 | $34,461 |
| 2021 | $2,092 | $42,420 | $7,959 | $34,461 |
| 2020 | $2,121 | $42,420 | $7,959 | $34,461 |
| 2019 | $2,117 | $38,917 | $7,301 | $31,616 |
| 2018 | $1,987 | $38,917 | $7,301 | $31,616 |
| 2017 | $1,864 | $38,917 | $7,301 | $31,616 |
| 2016 | $1,907 | $39,670 | $7,151 | $32,519 |
| 2015 | $1,933 | $39,670 | $7,151 | $32,519 |
| 2014 | $1,939 | $39,670 | $7,151 | $32,519 |
| 2013 | $2,127 | $44,570 | $8,033 | $36,537 |
Source: Public Records
Map
Nearby Homes
- 5930 Carpol St
- 5024 Lord Alfred Ct
- 11990 Thames Place
- 5164 Londonderry Dr
- 4365 Classic Dr
- 4195 Crystal View Ct
- 6891 Fields Ertel Rd
- 11143 Jardin Place
- 7815 Bennington Dr
- 4170 Cornell Rd
- 11108 Huntwicke Place
- 11928 2nd Ave
- 7812 Cincinnati Ave
- 9933 Hampstead Ct
- 4036 Haverstraw Dr
- 12152 3rd Ave
- 3875 Hauck Rd
- 3963 Malaer Dr
- 9917 Shorewood Ln
- 12152 7th Ave
- 5739 E Kemper Rd
- 5789 E Kemper Rd
- 5813 E Kemper Rd
- 5715 E Kemper Rd
- 5837 E Kemper Rd
- 5685 E Kemper Rd
- 5780 E Kemper Rd
- 5750 E Kemper Rd
- 5651 E Kemper Rd
- 5818 E Kemper Rd
- 5720 E Kemper Rd
- 5850 E Kemper Rd
- 5680 E Kemper Rd
- 5650 E Kemper Rd
- 5609 E Kemper Rd
- 5888 E Kemper Rd
- 5618 E Kemper Rd
- 5927 Carpol St
- 5933 Carpol St
- 5919 Carpol St
Your Personal Tour Guide
Ask me questions while you tour the home.