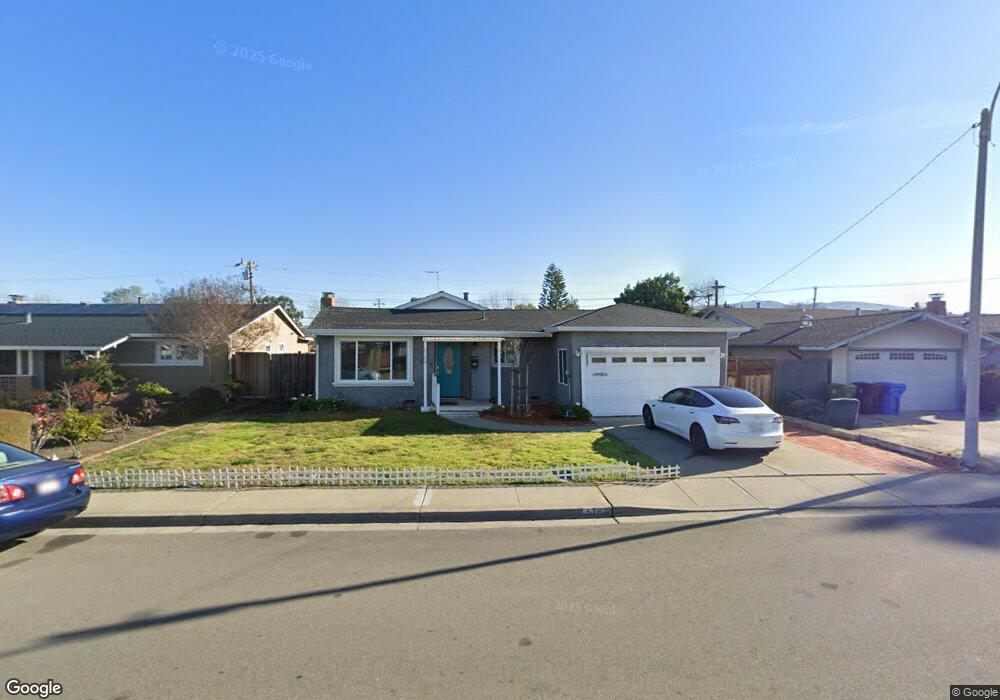
5764 Butano Park Dr Fremont, CA 94538
Blacow NeighborhoodEstimated Value: $1,515,000 - $1,622,570
3
Beds
2
Baths
1,131
Sq Ft
$1,375/Sq Ft
Est. Value
About This Home
This home is located at 5764 Butano Park Dr, Fremont, CA 94538 and is currently estimated at $1,554,643, approximately $1,374 per square foot. 5764 Butano Park Dr is a home located in Alameda County with nearby schools including Steven Millard Elementary, G.M. Walters Middle School, and John F. Kennedy High School.
Ownership History
Date
Name
Owned For
Owner Type
Purchase Details
Closed on
May 9, 2013
Sold by
Ostrom Diane Elvira and Williams Ronnie Eugene
Bought by
Burney Munsoor H and Burney Basmah I
Current Estimated Value
Home Financials for this Owner
Home Financials are based on the most recent Mortgage that was taken out on this home.
Original Mortgage
$384,000
Outstanding Balance
$272,350
Interest Rate
3.5%
Mortgage Type
New Conventional
Estimated Equity
$1,282,293
Purchase Details
Closed on
Aug 31, 2004
Sold by
Williams Gregory M and Millard S & Jesslyn Wiliams Tr
Bought by
Ostrom Diane Elvira and Beaton Tammy
Purchase Details
Closed on
Apr 20, 2002
Sold by
Williams Jesslyn and The Millard S & Jesslyn Willia
Bought by
Williams Gregory M and The Millard S & Jesslyn Willia
Purchase Details
Closed on
Sep 30, 1999
Sold by
Williams Millard S and Williams Jesslyn
Bought by
Williams Millard S and Williams Jesslyn
Create a Home Valuation Report for This Property
The Home Valuation Report is an in-depth analysis detailing your home's value as well as a comparison with similar homes in the area
Home Values in the Area
Average Home Value in this Area
Purchase History
| Date | Buyer | Sale Price | Title Company |
|---|---|---|---|
| Burney Munsoor H | $482,500 | Chicago Title Company | |
| Ostrom Diane Elvira | -- | -- | |
| Williams Gregory M | -- | -- | |
| Williams Millard S | -- | -- |
Source: Public Records
Mortgage History
| Date | Status | Borrower | Loan Amount |
|---|---|---|---|
| Open | Burney Munsoor H | $384,000 |
Source: Public Records
Tax History Compared to Growth
Tax History
| Year | Tax Paid | Tax Assessment Tax Assessment Total Assessment is a certain percentage of the fair market value that is determined by local assessors to be the total taxable value of land and additions on the property. | Land | Improvement |
|---|---|---|---|---|
| 2025 | $8,481 | $689,240 | $178,180 | $511,060 |
| 2024 | $8,481 | $675,728 | $174,687 | $501,041 |
| 2023 | $8,251 | $662,479 | $171,262 | $491,217 |
| 2022 | $8,139 | $649,493 | $167,905 | $481,588 |
| 2021 | $7,942 | $636,760 | $164,613 | $472,147 |
| 2020 | $7,946 | $630,233 | $162,926 | $467,307 |
| 2019 | $7,610 | $596,779 | $159,732 | $437,047 |
| 2018 | $7,255 | $567,434 | $156,601 | $410,833 |
| 2017 | $7,075 | $556,309 | $153,531 | $402,778 |
| 2016 | $6,952 | $545,402 | $150,521 | $394,881 |
| 2015 | $6,856 | $537,213 | $148,261 | $388,952 |
| 2014 | $6,737 | $526,689 | $145,356 | $381,333 |
Source: Public Records
Map
Nearby Homes
- 43163 Grimmer Terrace
- 5560 Boscell Common
- 4860 Bryce Canyon Park Dr
- 5341 Audubon Park Ct
- 48 Eagle Green
- 4537 Capewood Terrace
- 4533 Capewood Terrace
- 42932 Peachwood St
- 92 Delta Green
- 4751 Wadsworth Ct
- 4309 Bora Ave
- 40422 Landon Ave
- 40696 Robin St
- 202 Manitoba Terrace
- 208 Manitoba Terrace
- 262 Manitoba Green
- 41882 Gifford St
- 261 Manitoba Green Unit 261
- 257 Manitoba Green
- 4840 Piper St
- 5756 Butano Park Dr
- 5772 Butano Park Dr
- 5765 Antone Rd
- 5757 Antone Rd
- 5748 Butano Park Dr
- 5780 Butano Park Dr
- 5749 Antone Rd
- 5797 Ring Ct
- 5741 Antone Rd
- 5740 Butano Park Dr
- 5765 Butano Park Dr
- 5773 Butano Park Dr
- 5789 Ring Ct
- 5781 Butano Park Dr
- 5735 Antone Rd
- 5732 Butano Park Dr
- 5788 Antone Rd
- 5789 Butano Park Dr
- 5772 Antone Rd
- 5764 Antone Rd