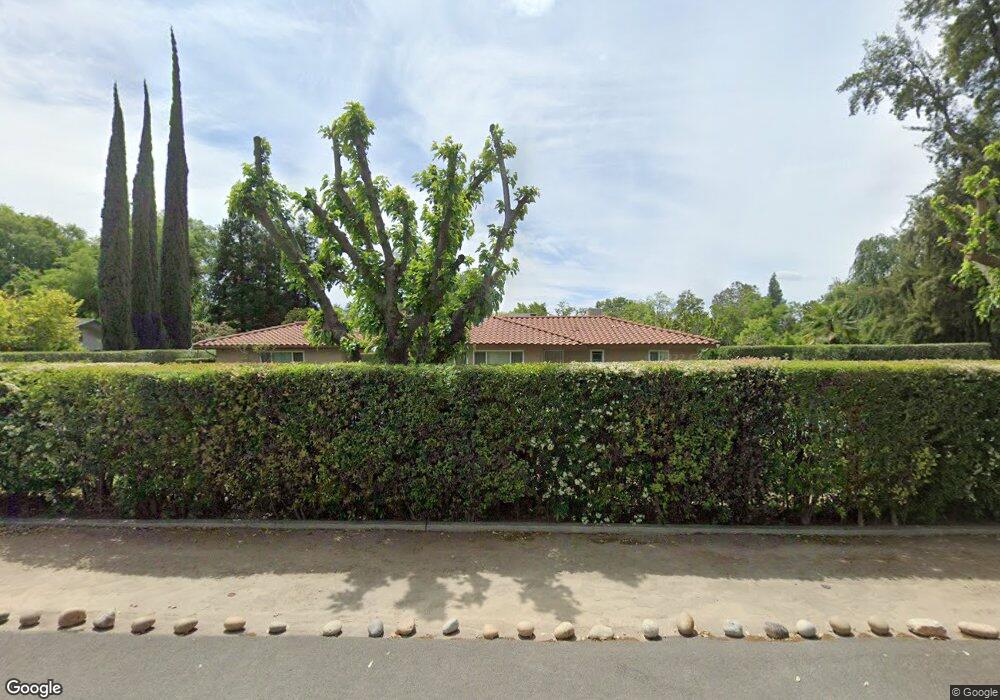
5764 E Waverly Ln Fresno, CA 93727
Sunnyside NeighborhoodEstimated Value: $470,000 - $608,000
3
Beds
2
Baths
1,892
Sq Ft
$280/Sq Ft
Est. Value
About This Home
This home is located at 5764 E Waverly Ln, Fresno, CA 93727 and is currently estimated at $530,683, approximately $280 per square foot. 5764 E Waverly Ln is a home located in Fresno County with nearby schools including Ayer Elementary School, Elizabeth Terronez Middle School, and Sunnyside High School.
Ownership History
Date
Name
Owned For
Owner Type
Purchase Details
Closed on
Jan 9, 2012
Sold by
Srd Investments Inc
Bought by
Commercial Asset Group Llc
Current Estimated Value
Purchase Details
Closed on
Dec 19, 2011
Sold by
Tomaino John J
Bought by
Srd Investments Inc
Purchase Details
Closed on
May 10, 2004
Sold by
Tomaino Alla Vladimirovna
Bought by
Tomaino John J
Home Financials for this Owner
Home Financials are based on the most recent Mortgage that was taken out on this home.
Original Mortgage
$287,200
Interest Rate
5.62%
Mortgage Type
New Conventional
Purchase Details
Closed on
Feb 22, 2002
Sold by
Bell Scott W and Brown Joan B
Bought by
Burnell Friday Penfield
Home Financials for this Owner
Home Financials are based on the most recent Mortgage that was taken out on this home.
Original Mortgage
$168,000
Interest Rate
6.37%
Create a Home Valuation Report for This Property
The Home Valuation Report is an in-depth analysis detailing your home's value as well as a comparison with similar homes in the area
Home Values in the Area
Average Home Value in this Area
Purchase History
| Date | Buyer | Sale Price | Title Company |
|---|---|---|---|
| Commercial Asset Group Llc | $165,000 | Placer Title Company | |
| Srd Investments Inc | $144,500 | None Available | |
| Tomaino John J | -- | Chicago Title Co | |
| Tomaino John J | $359,000 | Chicago Title Co | |
| Burnell Friday Penfield | $210,000 | Chicago Title Co |
Source: Public Records
Mortgage History
| Date | Status | Borrower | Loan Amount |
|---|---|---|---|
| Previous Owner | Tomaino John J | $287,200 | |
| Previous Owner | Burnell Friday Penfield | $168,000 | |
| Closed | Tomaino John J | $35,900 |
Source: Public Records
Tax History Compared to Growth
Tax History
| Year | Tax Paid | Tax Assessment Tax Assessment Total Assessment is a certain percentage of the fair market value that is determined by local assessors to be the total taxable value of land and additions on the property. | Land | Improvement |
|---|---|---|---|---|
| 2025 | $2,528 | $207,237 | $75,357 | $131,880 |
| 2023 | $2,480 | $199,192 | $72,432 | $126,760 |
| 2022 | $2,447 | $195,287 | $71,012 | $124,275 |
| 2021 | $2,379 | $191,459 | $69,620 | $121,839 |
| 2020 | $2,369 | $189,497 | $68,907 | $120,590 |
| 2019 | $2,277 | $185,782 | $67,556 | $118,226 |
| 2018 | $2,228 | $182,140 | $66,232 | $115,908 |
| 2017 | $2,190 | $178,570 | $64,934 | $113,636 |
| 2016 | $2,117 | $175,069 | $63,661 | $111,408 |
| 2015 | $2,084 | $172,440 | $62,705 | $109,735 |
| 2014 | $2,046 | $169,063 | $61,477 | $107,586 |
Source: Public Records
Map
Nearby Homes
- 5821 E Rancho Dr
- 945 S Clovis Ave Unit H
- 945 S Clovis Ave Unit G
- 945 S Clovis Ave Unit V
- 1010 S Clovis Ave Unit 107
- 935 S Park Circle Dr
- 5894 E Hamilton Ave
- 5912 E Hamilton Ave
- 930 S Park Circle Dr
- 5976 E Butler Ave
- 372 S Argyle Ave Unit 102
- 742 S Park Circle Dr
- 1904 S Fairway Ave
- 5478 E Butler Ave
- 350 S Argyle Ave Unit 103
- 350 S Argyle Ave Unit 101
- 6080 E Platt Ave
- 5490 E 9 Ave
- 1234 Address Unavailable
- 337 S Stanford Ave
- 5750 E Waverly Ln
- 1304 S Sunnyside Ave
- 5759 E Waverly Ln
- 5735 E Butler Ave
- 1252 S Sunnyside Ave
- 5734 E Waverly Ln
- 5721 E Butler Ave
- 5747 E Waverly Ln
- 1241 S Phillip Ave
- 5749 E Butler Ave
- 1313 S Phillip Ave
- 1215 S Phillip Ave
- 5735 E Waverly Ln
- 5757 E Butler Ave
- 1255 S Sunnyside Ave
- 1240 S Sunnyside Ave
- 5715 E Butler Ave
- 5698 E Park Circle Dr
- 5775 E Butler Ave
- 5730 E Park Circle Dr